Help
There are some general FAQs listed below explaining how the tool works, and datasets used for the tissue-specific gene enrichment. In case of any other questions please contact
geetu@iastate.edu
.
- How to cite TissueEnrich in your research?
- What are the different datasets used for tissue-specific gene enrichment in TissueEnrich?
- What are the different tissue-specific gene groups used for tissue-specific gene enrichment?
- Can we use background genes for carrying out tissue-specific gene enrichment?
- How can TissueEnrich be used to calculate tissue-specific gene enrichment?
- How can TissueEnrich be used to calculate tissue-specific gene enrichment for orthologous genes between human and mouse?
- How expression details of genes in the datasets be obtained?
- How should I interpret my results?
Datasets
TissueEnrich defines tissue-specific genes using RNA-Seq data from the HPA, GTEx, and mouse ENCODE. In order to make the tissue-specific gene calculations more robust, we only used tissues that had ≥2 biological replicates. The datasets used in the tool are:
-
Human Protein Atlas:
RNA-Seq data across 35 human tissues (Uhlén et al. 2015)
-
GTEx:
RNA-Seq data across 29 human tissues (Ardlie et al. 2015)
-
Mouse ENCODE:
RNA-Seq data across 17 mouse tissues (Shen et al. 2012)
Note:
The tissues isolated from embryonic stages are prefixed with 'E' followed by the timepoint. For example in Mouse ENCODE data, the placenta tissue isolated from embryonic day 14.5 is named as E14.5-Placenta. All the other tissues are isolated from adults.
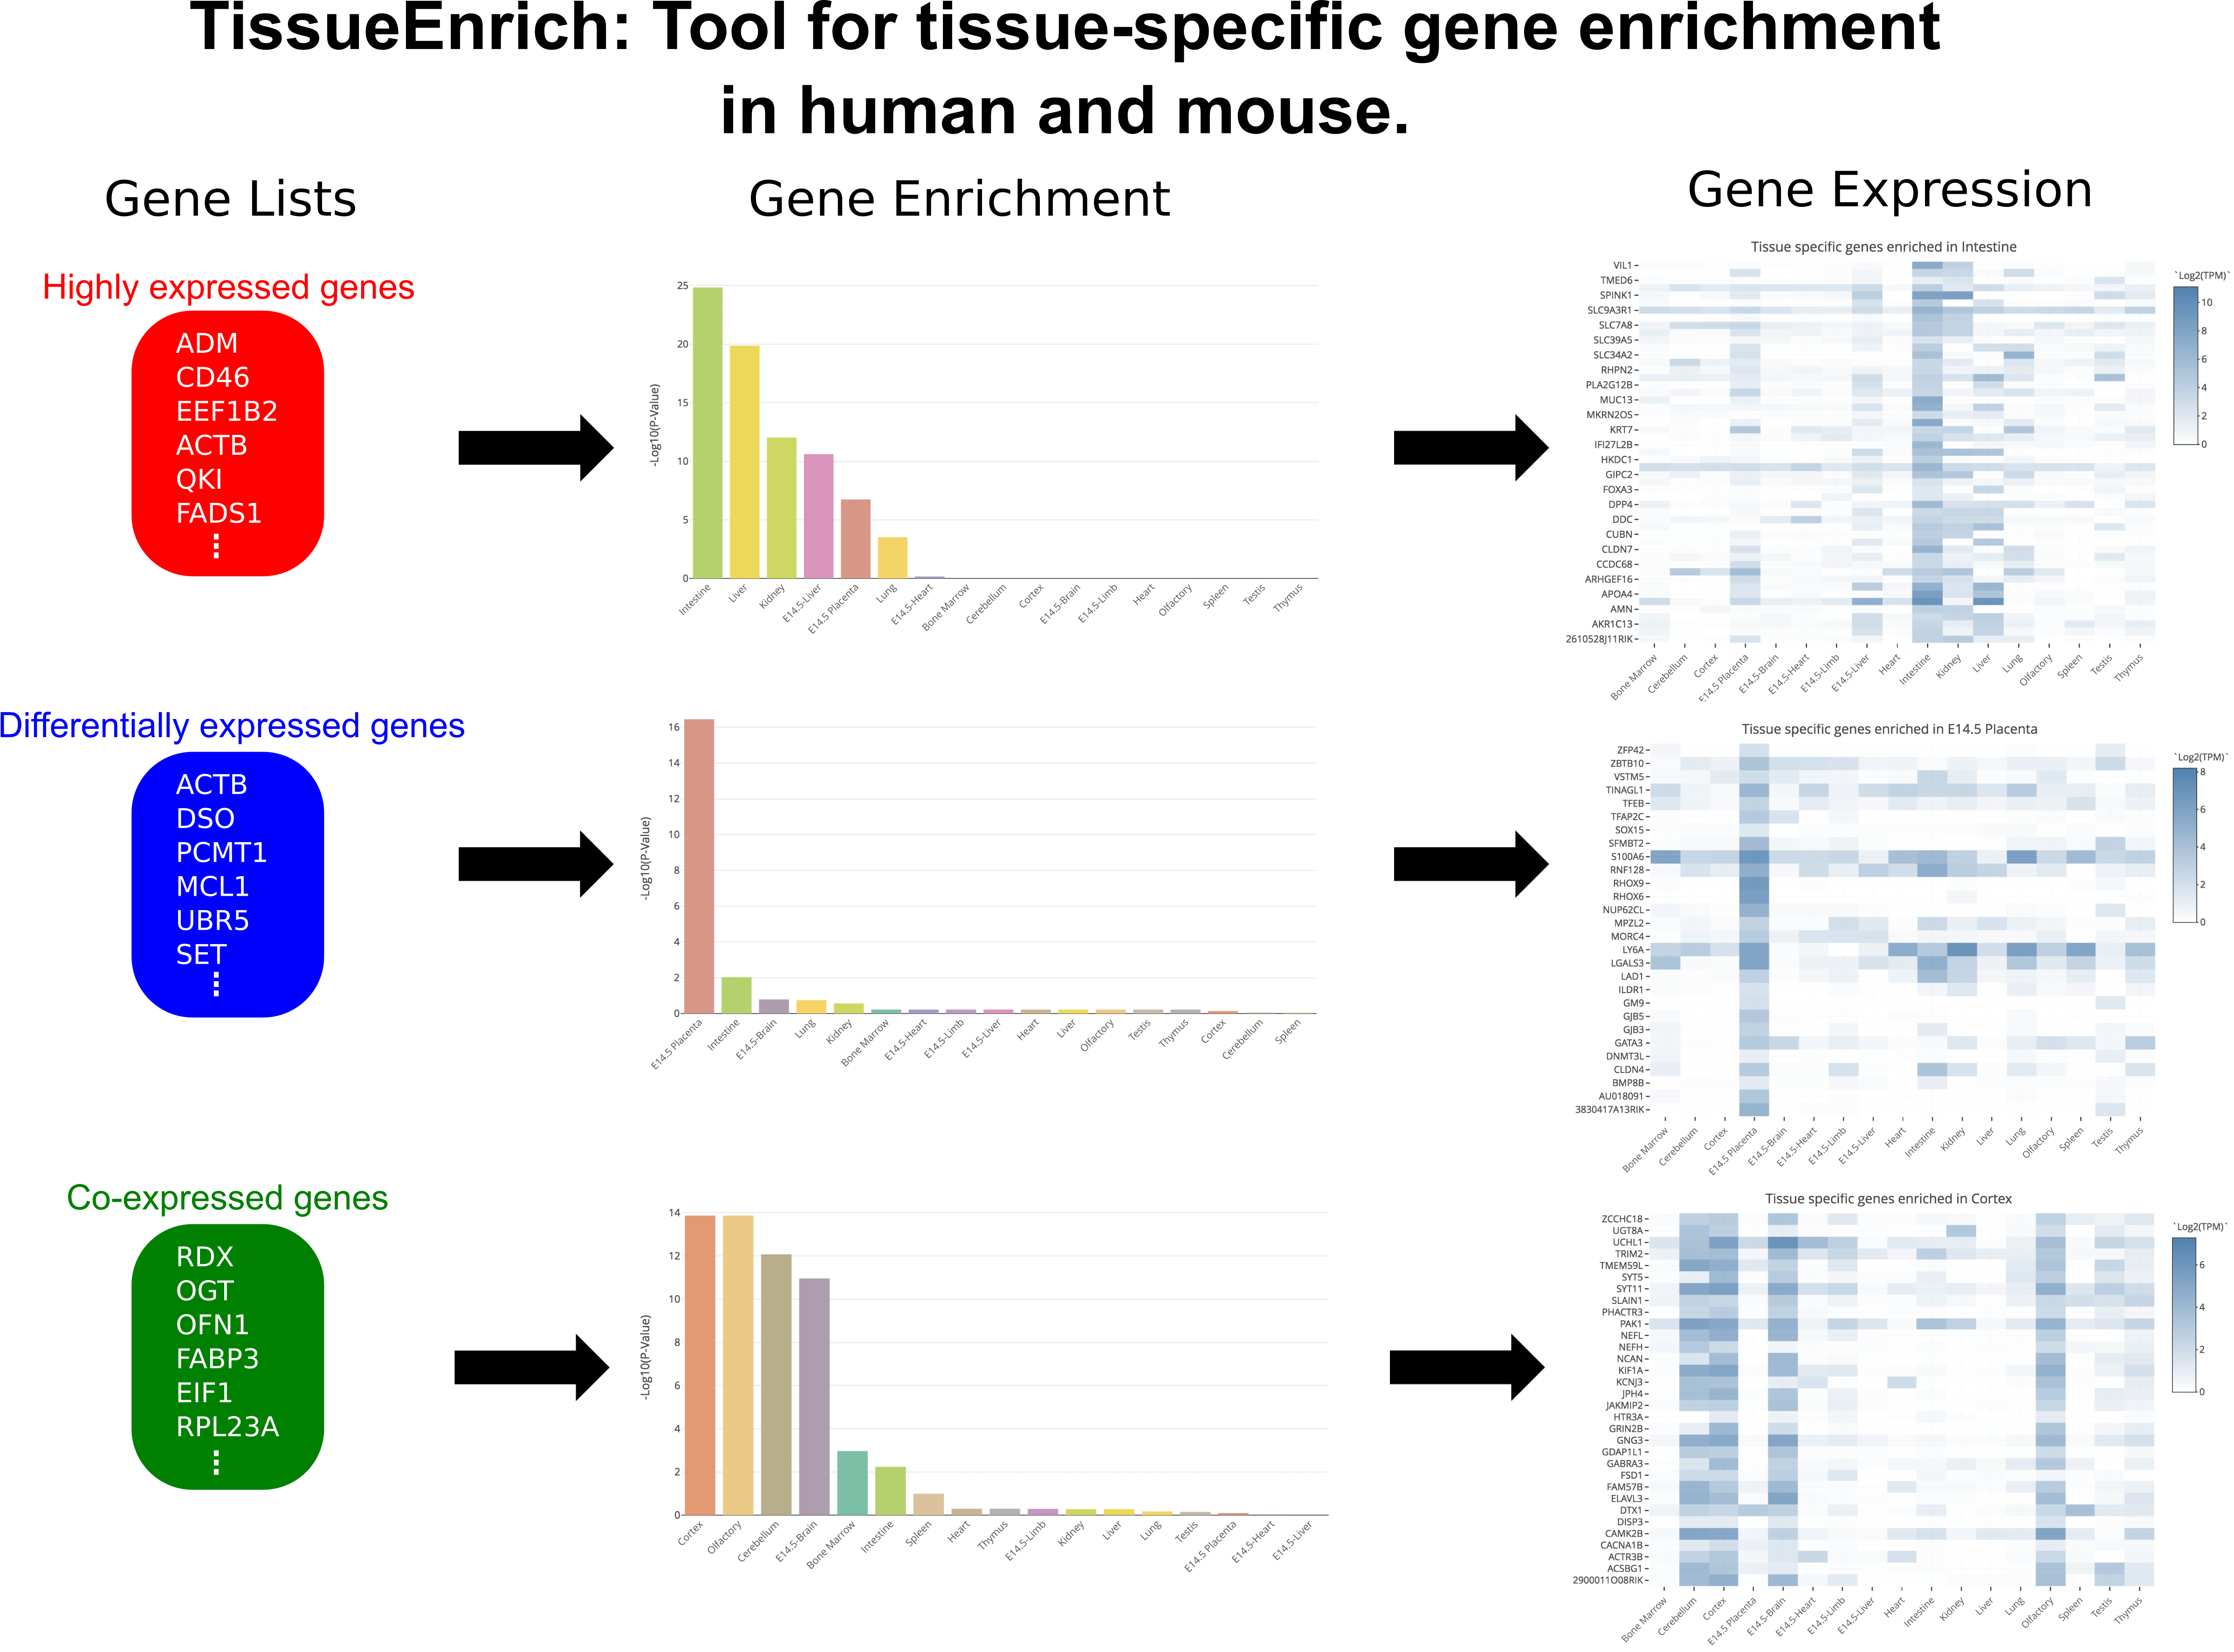
Defining Tissue-specific Genes
Tissue-specific genes are defined using the algorithm from the HPA (Uhlén et al. 2015), and can be grouped as follows:
-
Not Expressed:
Genes with an expression level less than 1 (TPM or FPKM) across all the tissues.
-
Tissue Enriched:
Genes with an expression level greater than or equal to 1 (TPM or FPKM) that also have at least five-fold higher expression levels in a particular tissue compared to all other tissues.
-
Group Enriched:
Genes with an expression level greater than or equal to 1 (TPM or FPKM) that also have at least five-fold higher expression levels in a group of 2-7 tissues compared to all other tissues, and that are not considered Tissue Enriched.
-
Tissue Enhanced:
Genes with an expression level greater than or equal to 1 (TPM or FPKM) that also have at least five-fold higher expression levels in a particular tissue compared to the average levels in all other tissues, and that are not considered Tissue Enriched or Group Enriched.
-
Expressed in all:
Genes with an expression level greater than or equal to 1 (TPM or FPKM) across all of the tissues that are not in any of the above 4 groups.
-
Mixed:
Genes that are not assigned to any of the above 5 groups.
Genes from the
Tissue Enriched
,
Group Enriched
, and
Tissue Enhanced
groups are classified as tissue-specific genes.
Background Genes
TissueEnrich enables users to provide the background genes for carrying out tissue-specific gene enrichment. In this case, instead of using all the genes in the dataset, a background gene set is being used to carry out the enrichment analysis. It should be noted that the background gene set must have all the genes of the input gene set. The p-value is calculated as:
$$P(X \gt k) = \sum\limits_{i=k+1}^n \frac{{{K_b}\choose{i}} {{N_b-K_b}\choose{n-i}}}{{{N_b}\choose{n}}}$$
Where, \(N_{b}\) is the total number of background genes, \(K_{b}\) is the total number of tissue-specific genes for a tissue in background genes, n is the number of genes in the input gene set, k is the number of tissue-specific genes in the input gene set. The p-values are corrected for multiple hypothesis testing using the Benjamini & Hochberg correction. If the background gene set is not provided all the genes will be used as background.
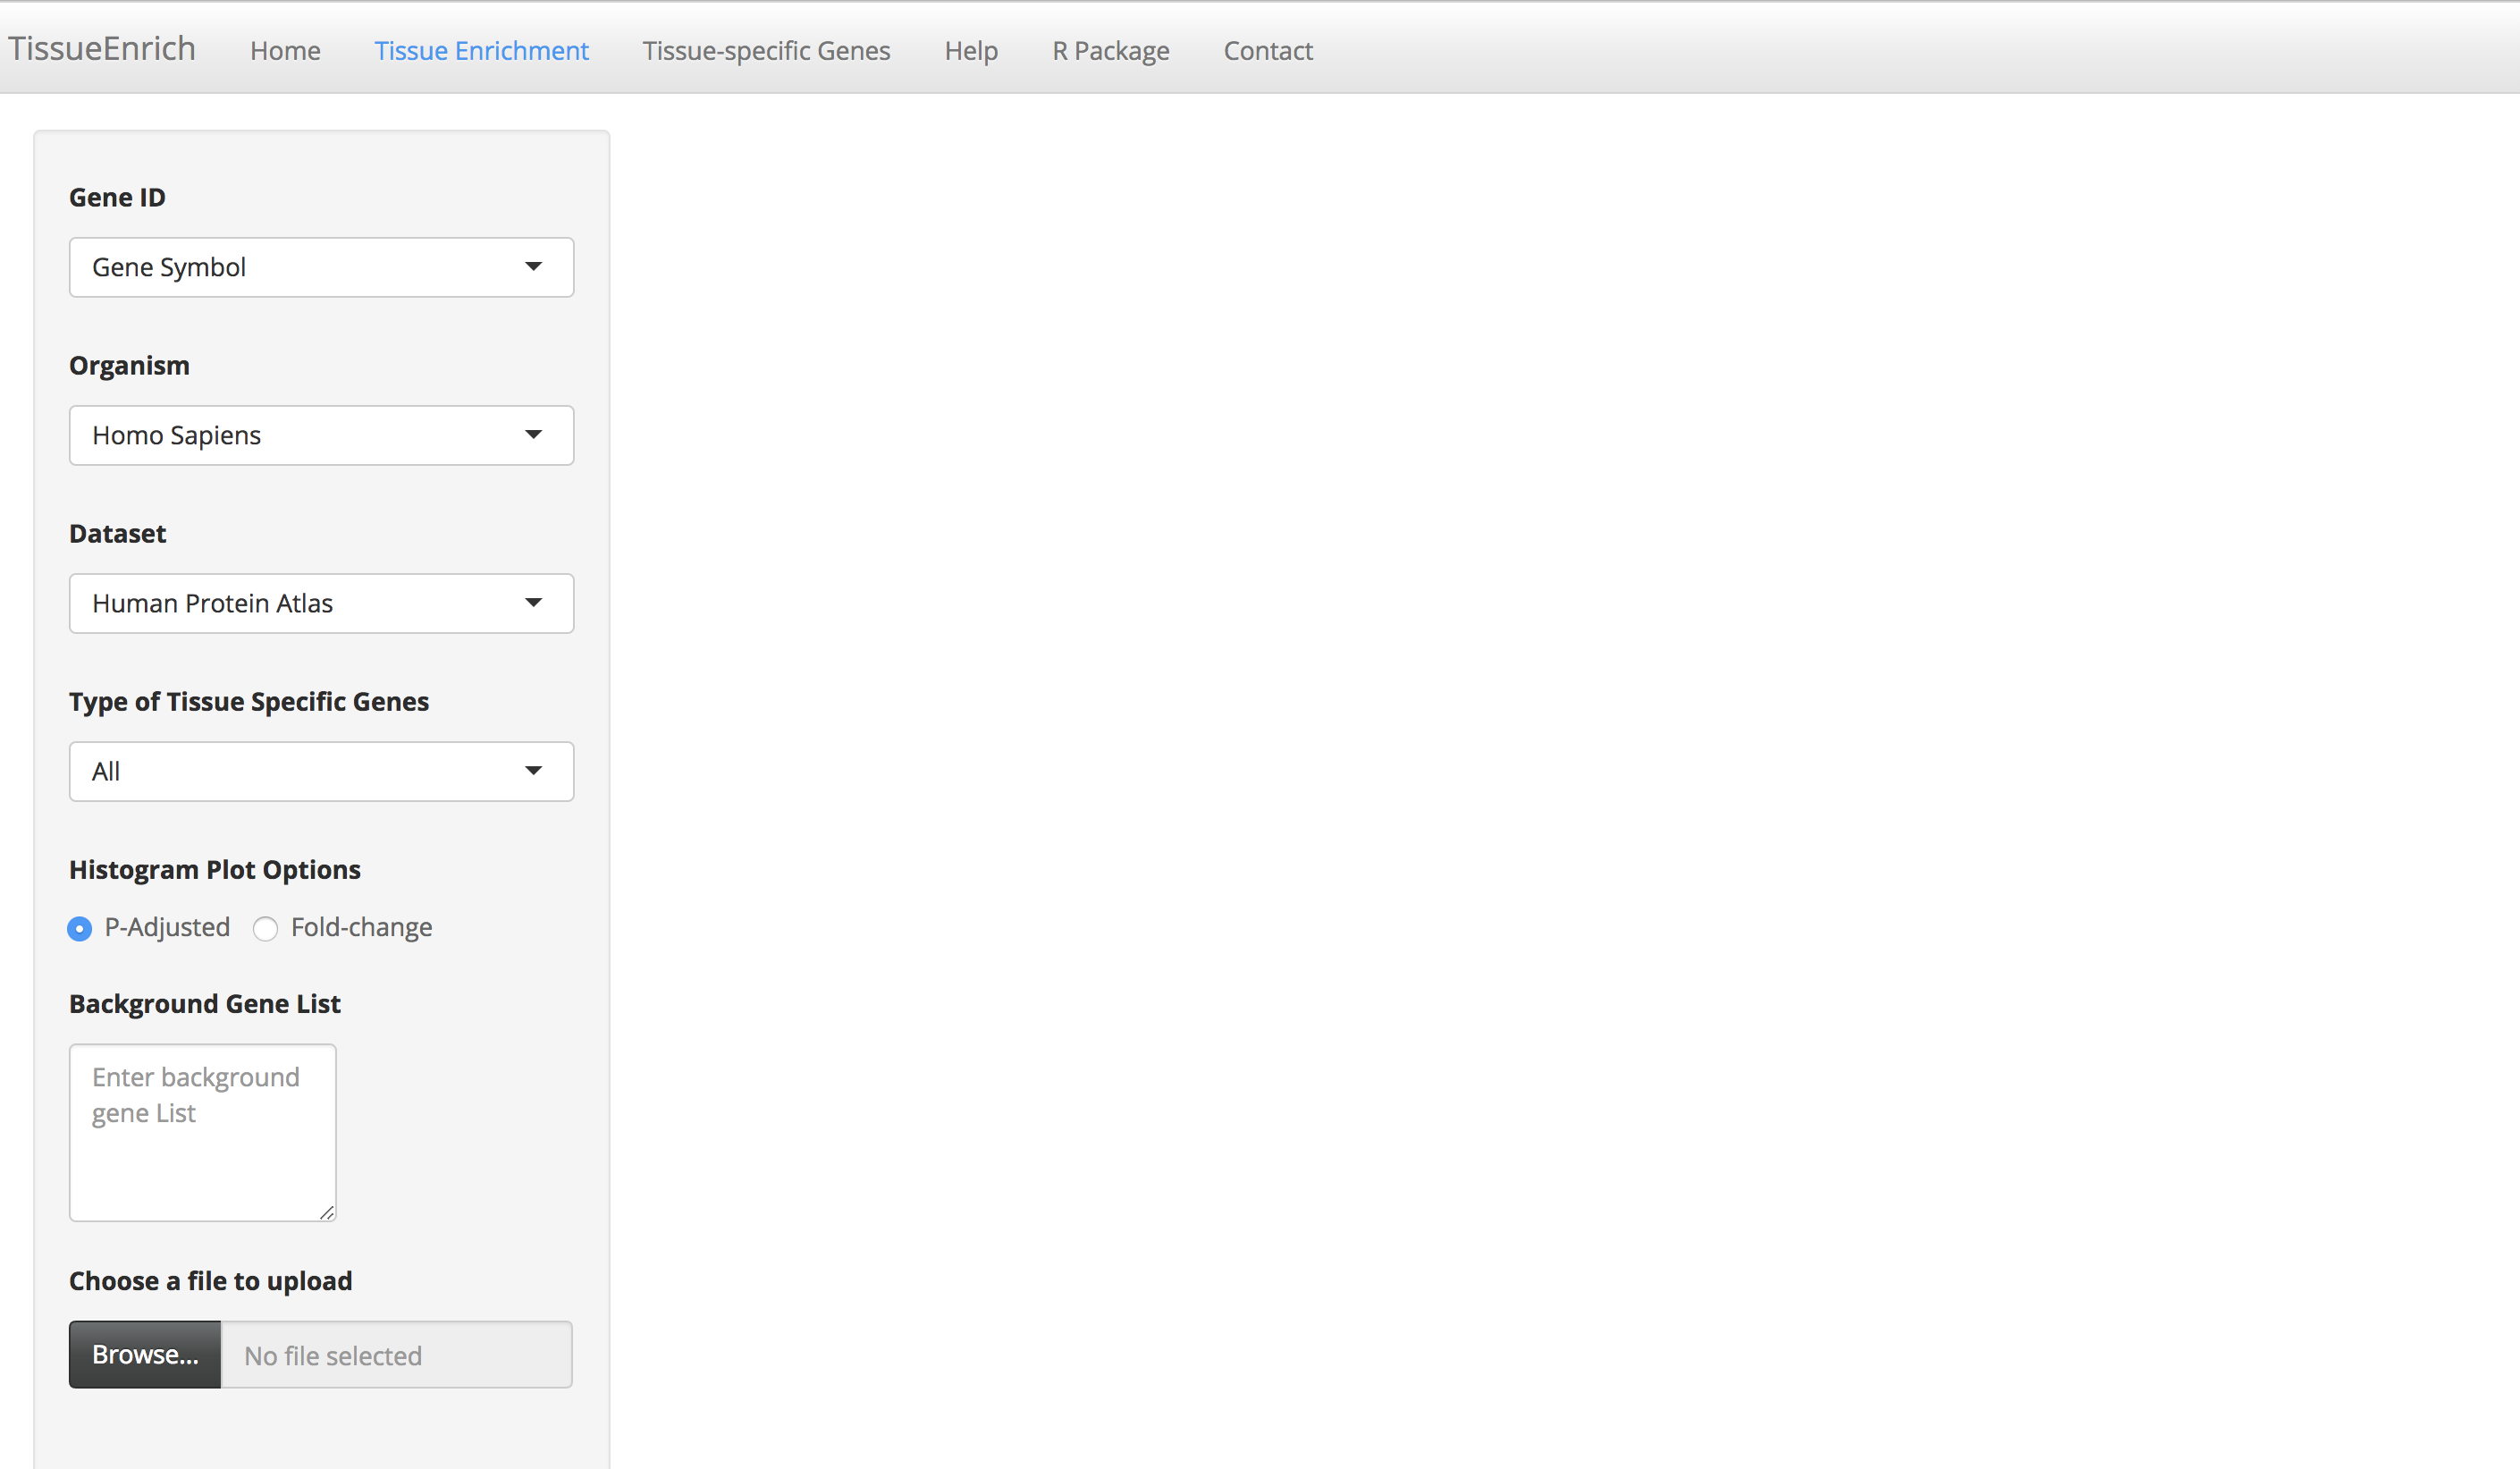
Steps to calculate tissue-specific gene enrichment
-
Click the "Tissue Enrichment" tab to go to the tissue enrichment page.
-
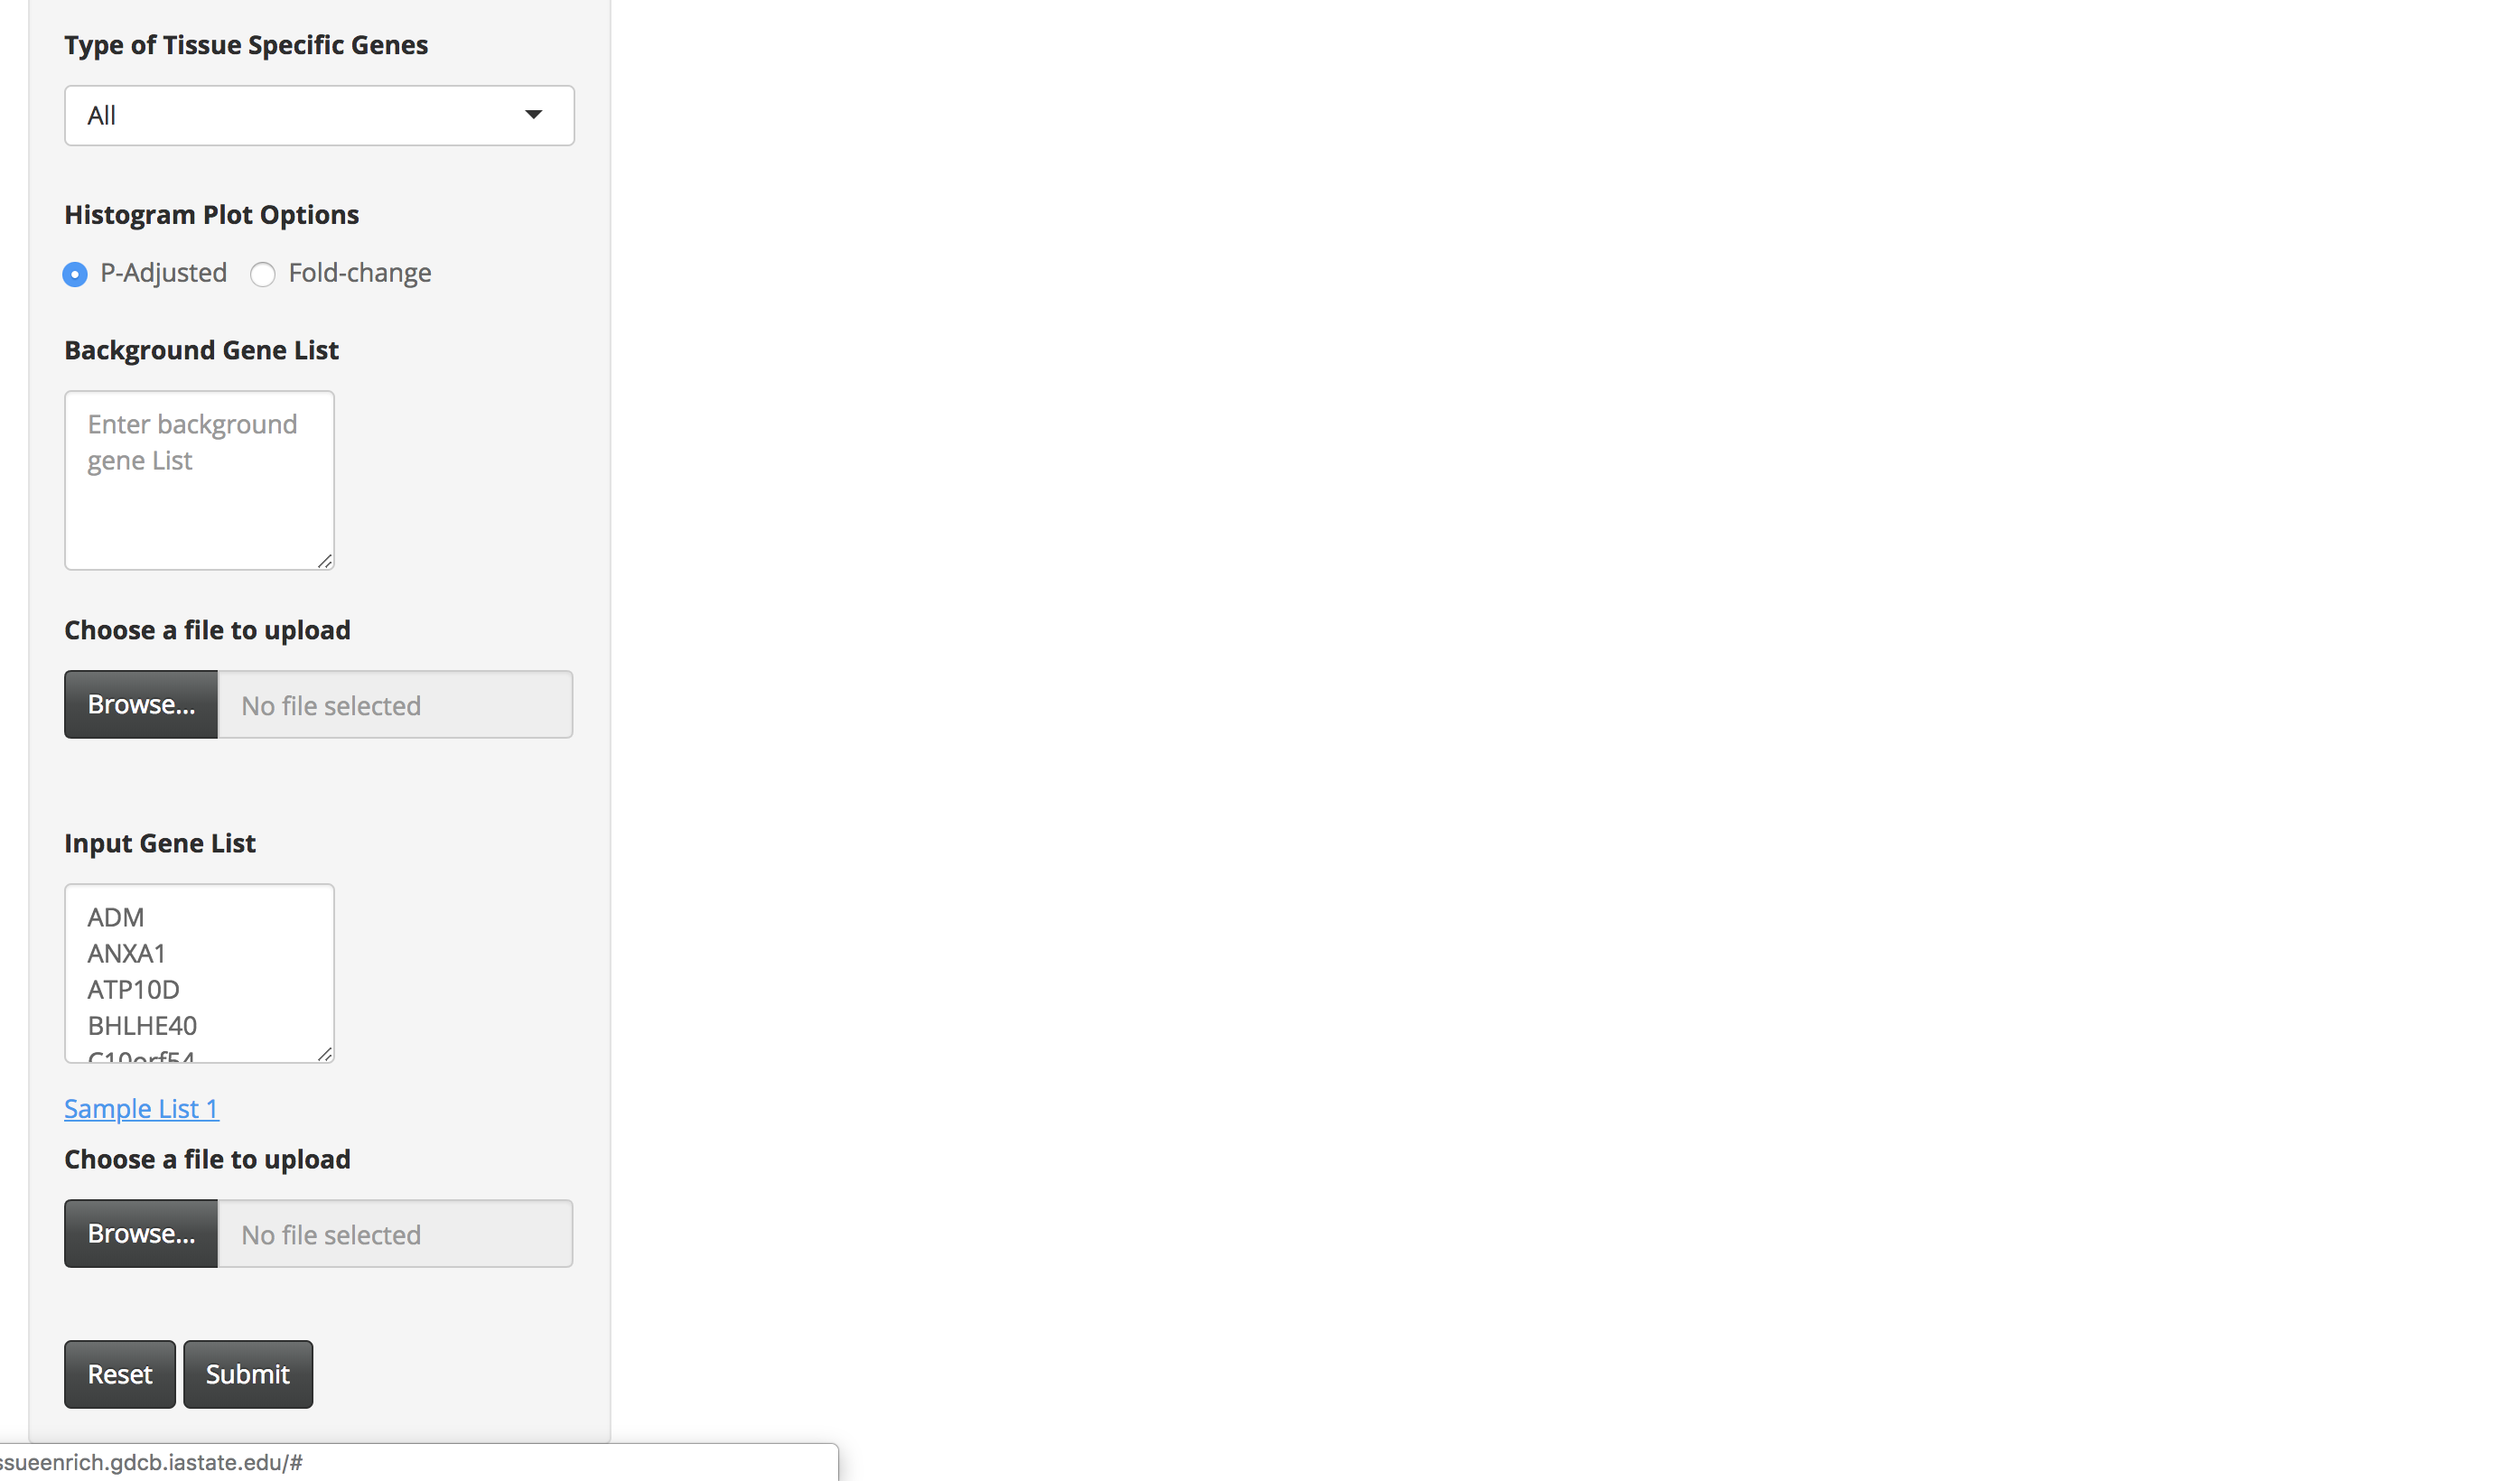
Enter a gene list by either pasting it in the "Gene List" text area or by uploading the file (.txt/.csv extension). Each gene ID in the gene list should be in a new line.
-
Choose the appropriate options provided on the page, for example, organism (of the input gene set), gene Id, dataset, and type of tissue-specific genes.
-
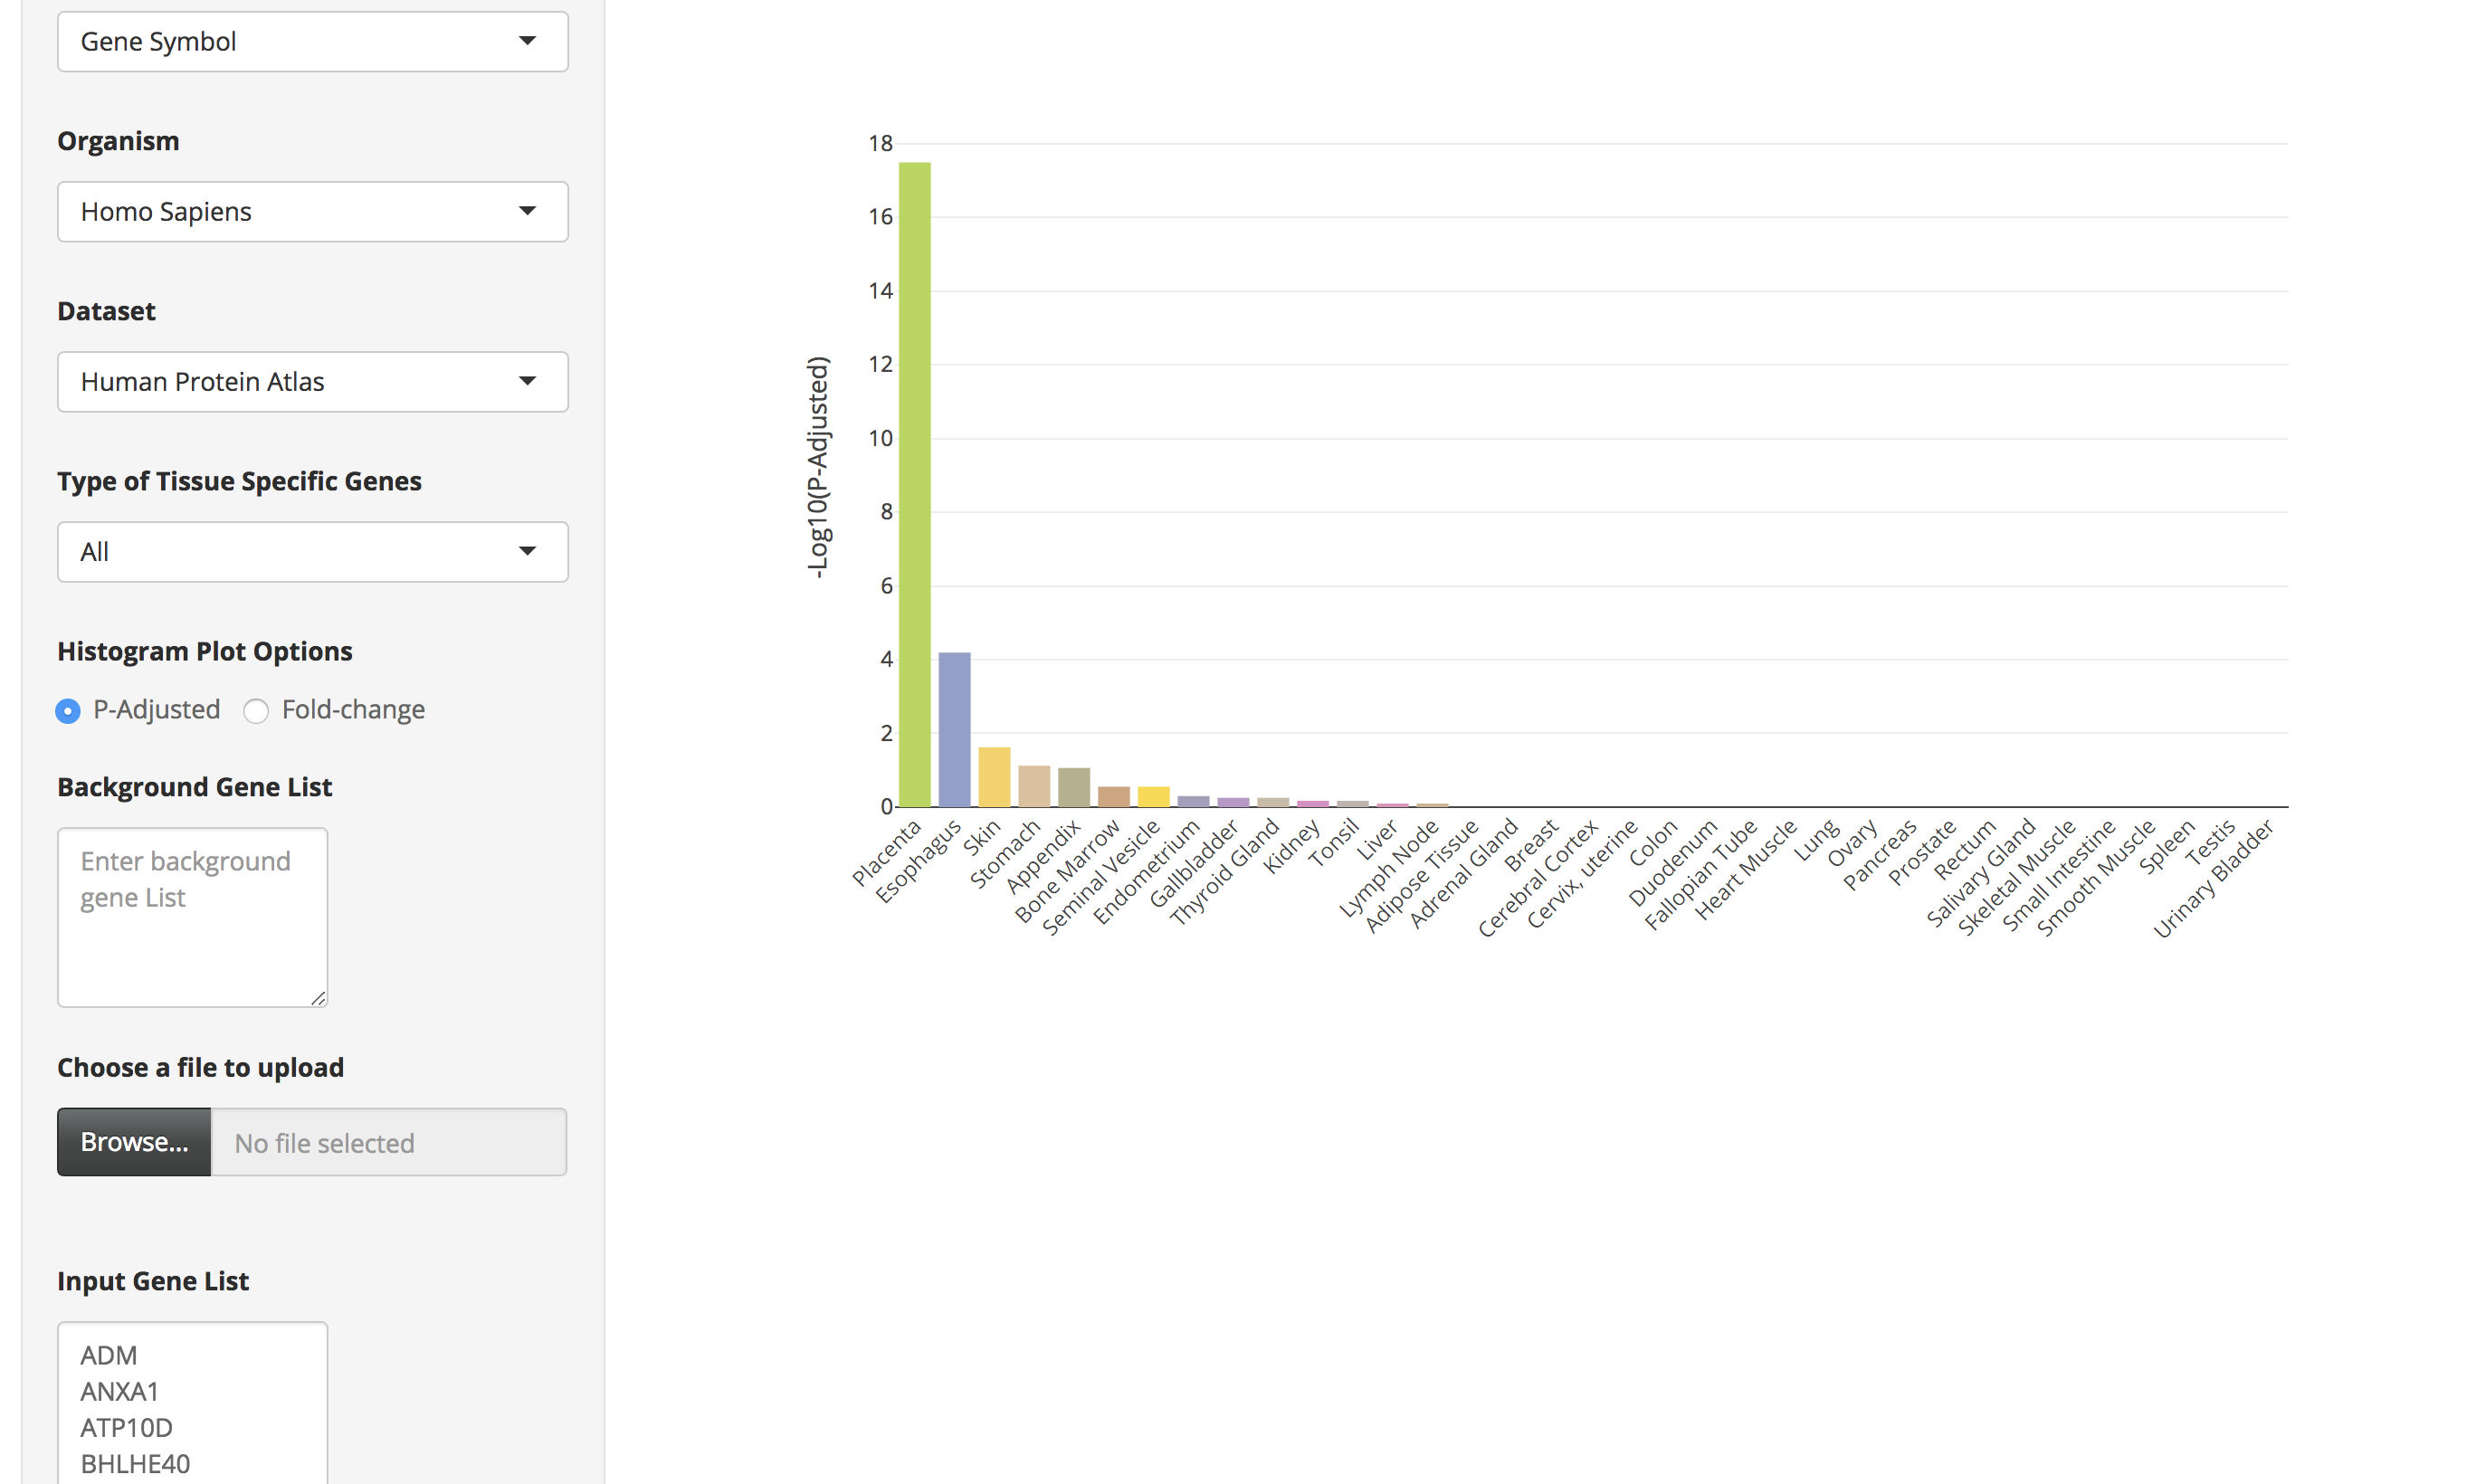
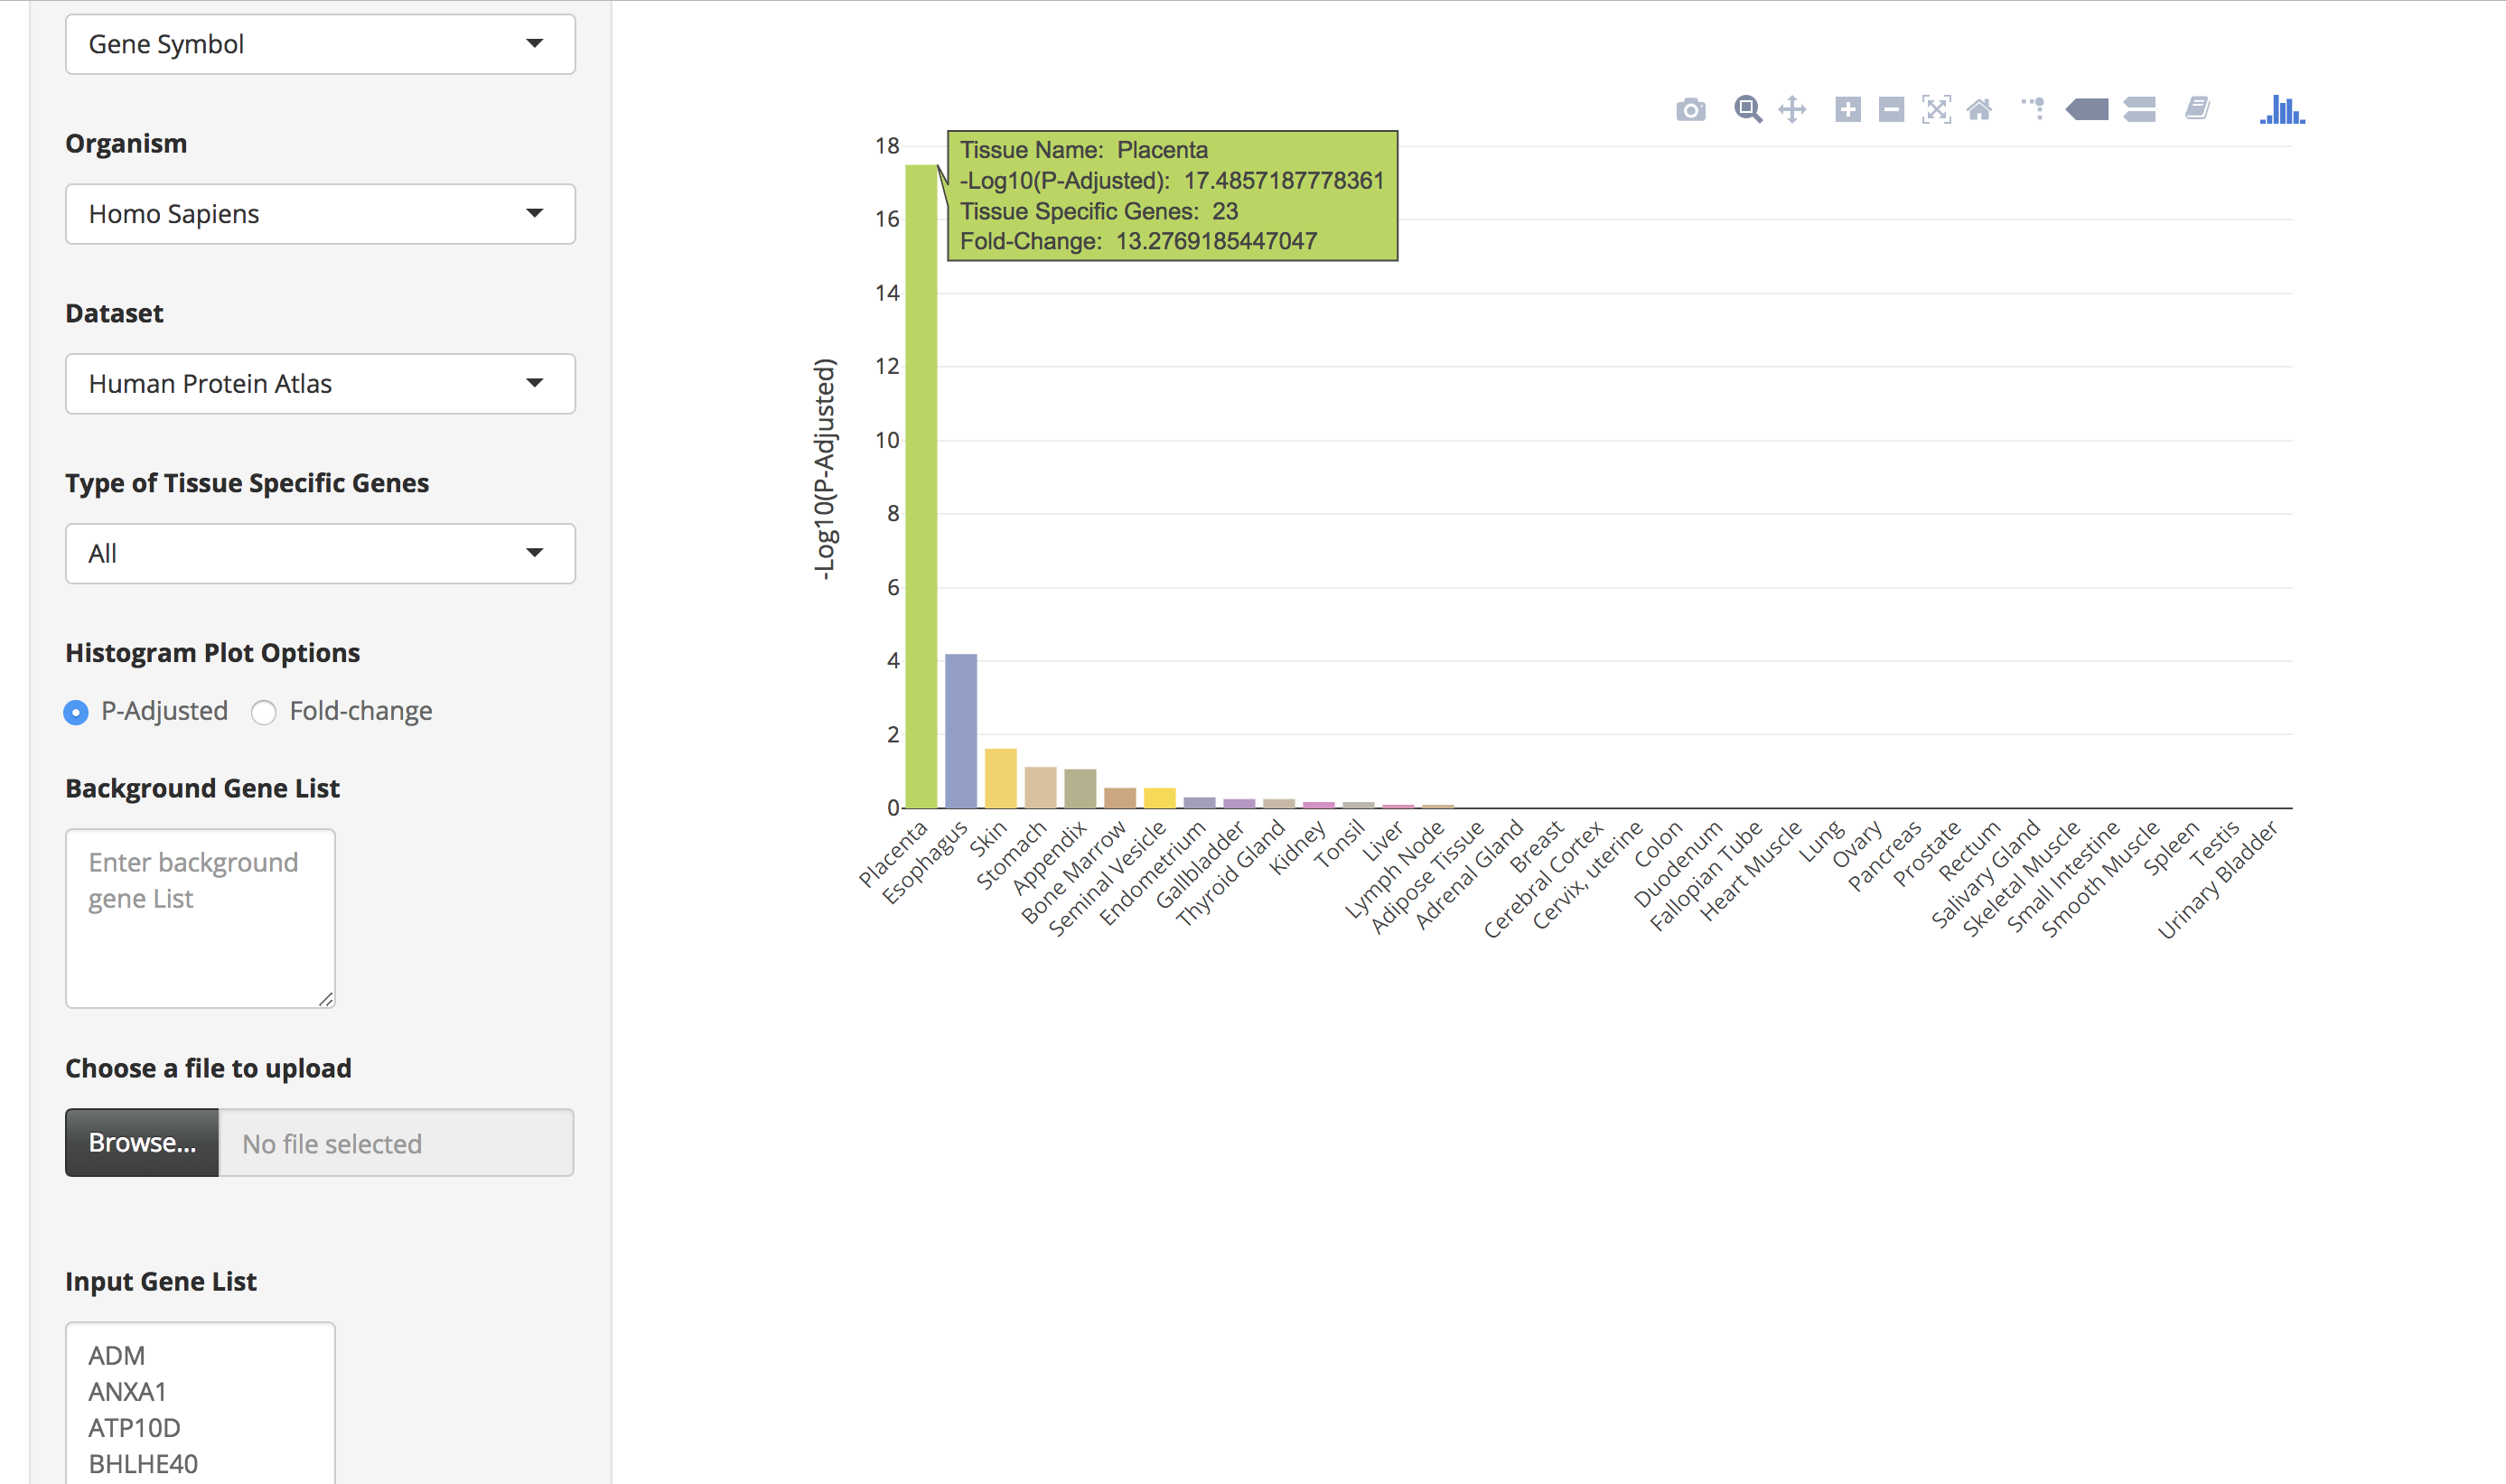
Sample List 1 contains 100 trophectoderm-specific genes identified from single cell RNA-Seq analyses (Petropoulos et al. 2016). Because placenta is derived from the trophoectoderm, we would expect TissueEnrich to show tissue-specific enrichment of placenta tissue. We used the HPA data for this analysis, since GTEx does not include data from placenta.
-
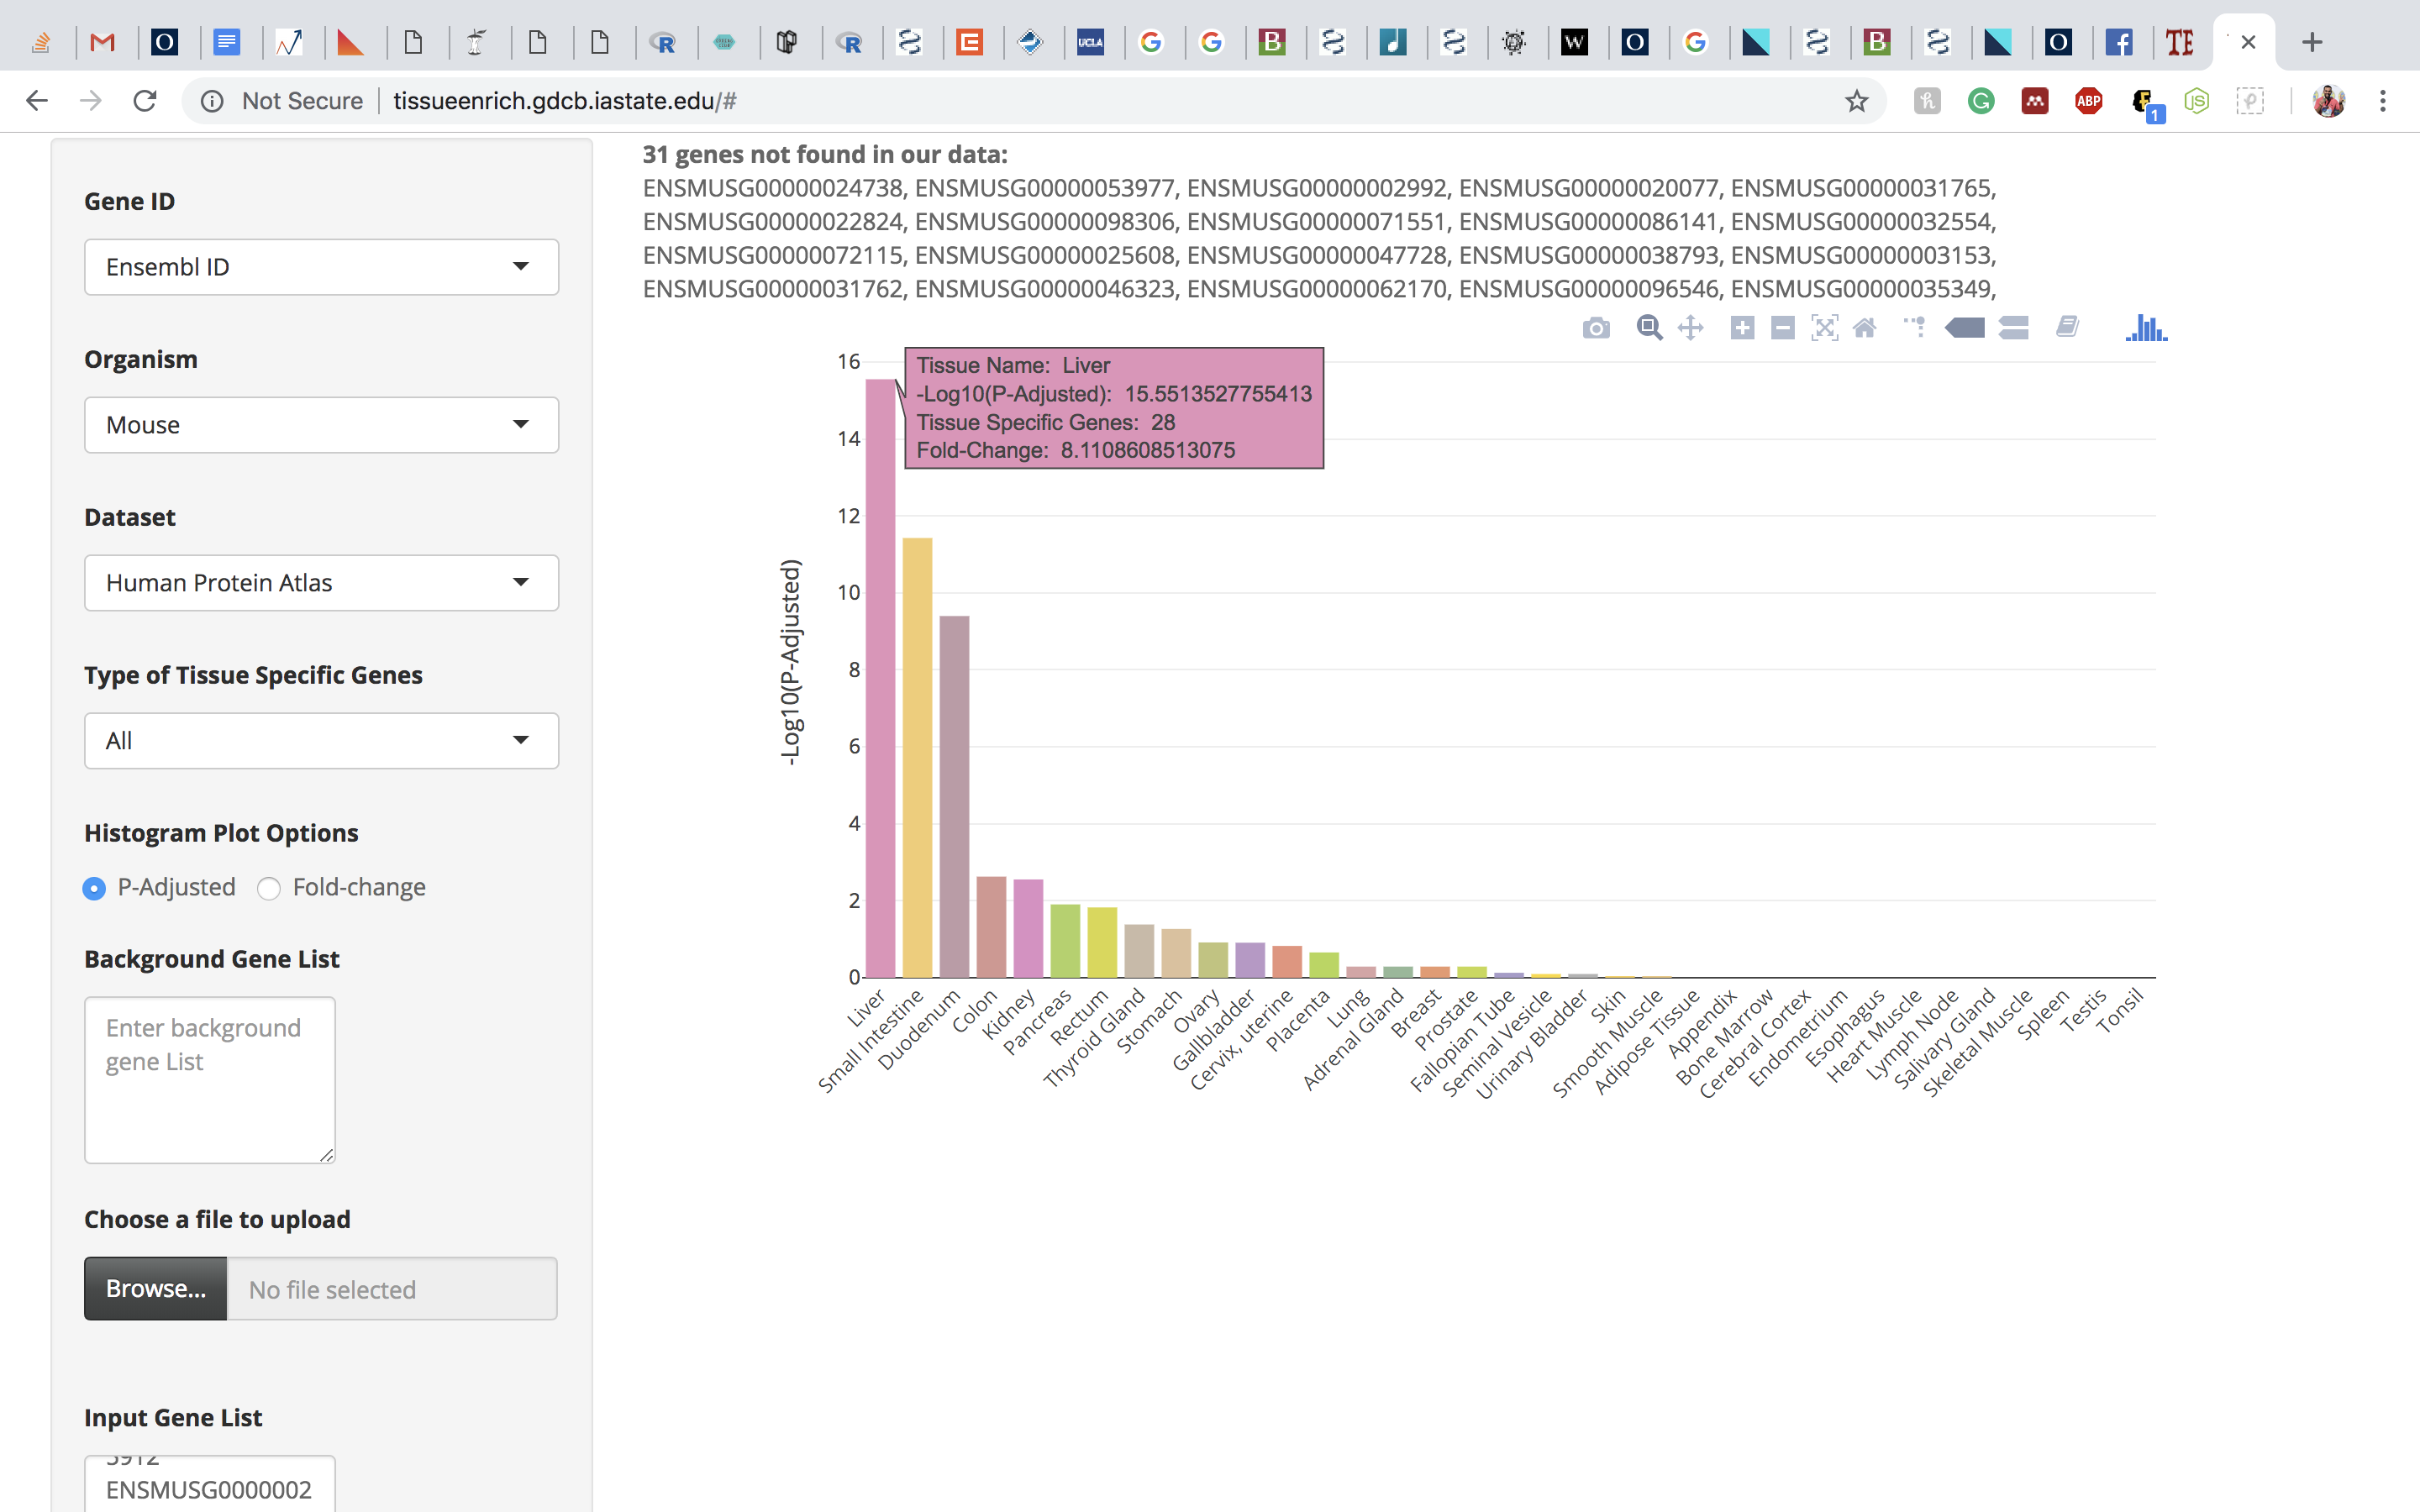
Click on the submit button. A bar chart will be generated, showing the enrichment of tissue-specific genes in your list. Above the bar chart, you will also find the genes that could not be mapped to the tissue-specific genes.
-
The bar charts are interactive and the user can hover over the bar chart to see the tissue name, the number of tissue-specific genes from the input data, fold change, and the enrichment scores (-Log10(P-Adjusted)).
-
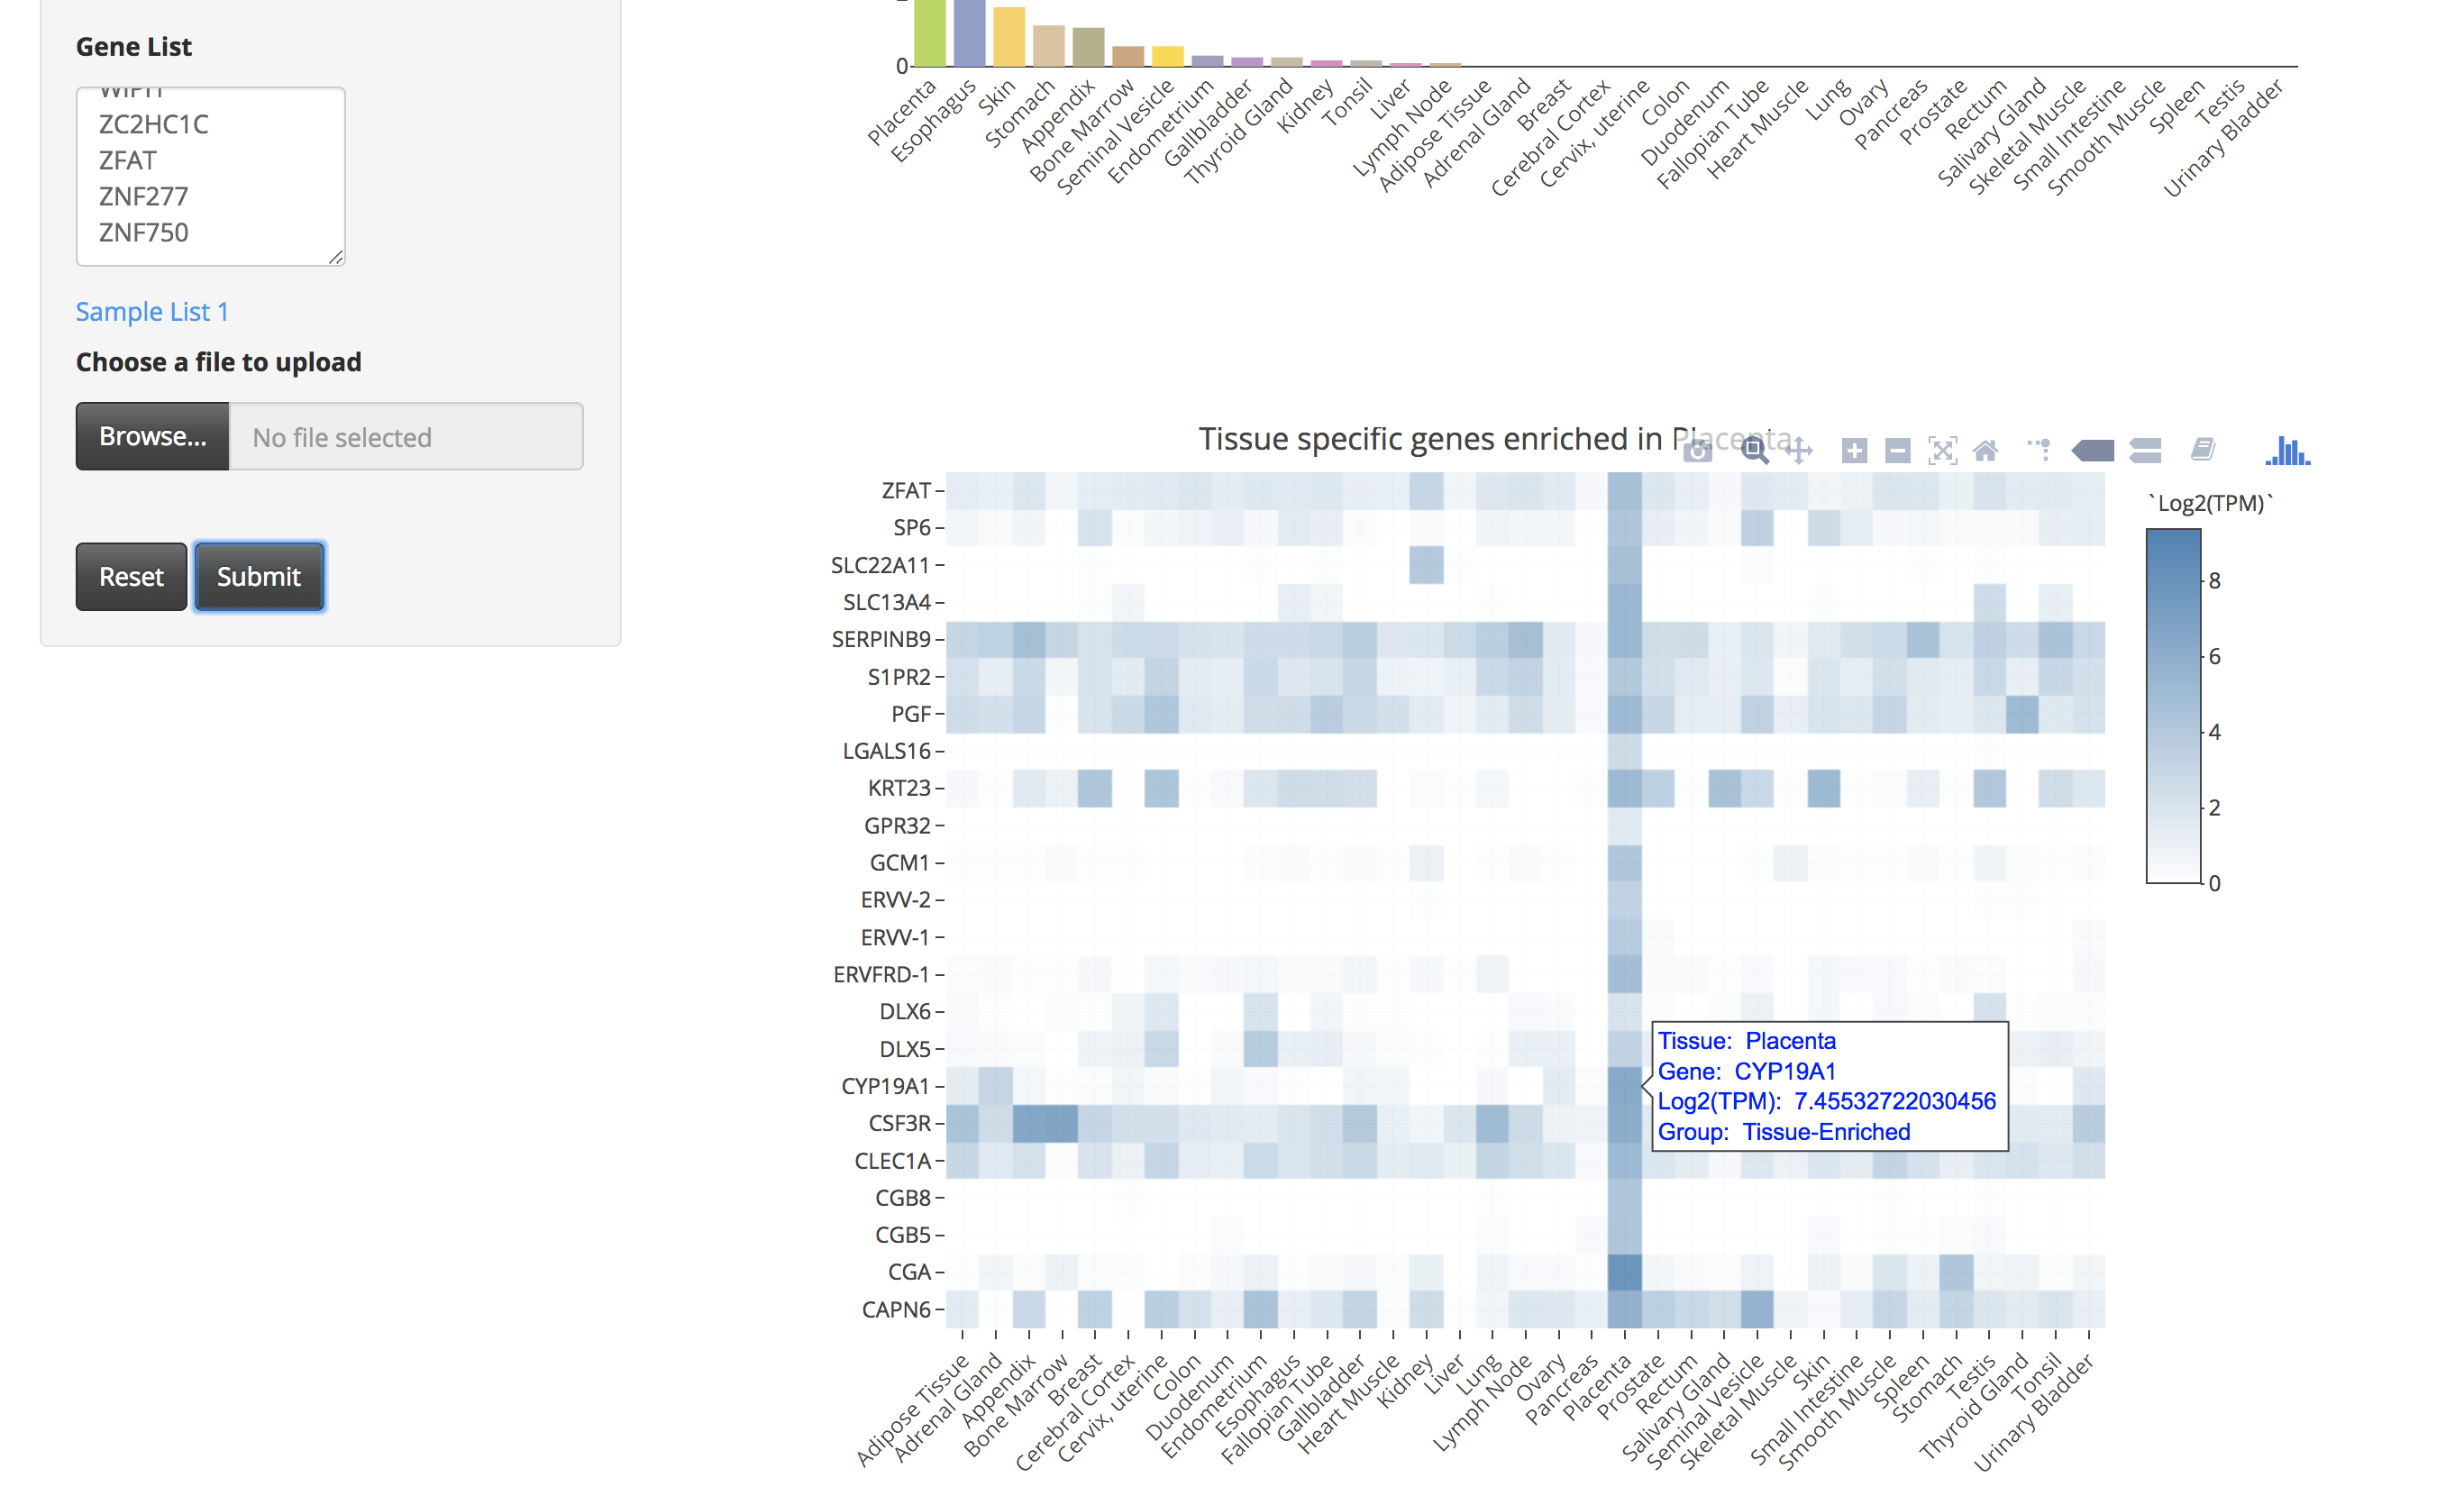
By clicking on the bar of the bar chart, the user can visualize the expression of those tissue-specific genes in a heatmap. The user can also hover over the heatmap to see details of genes in a particular tissue.
-
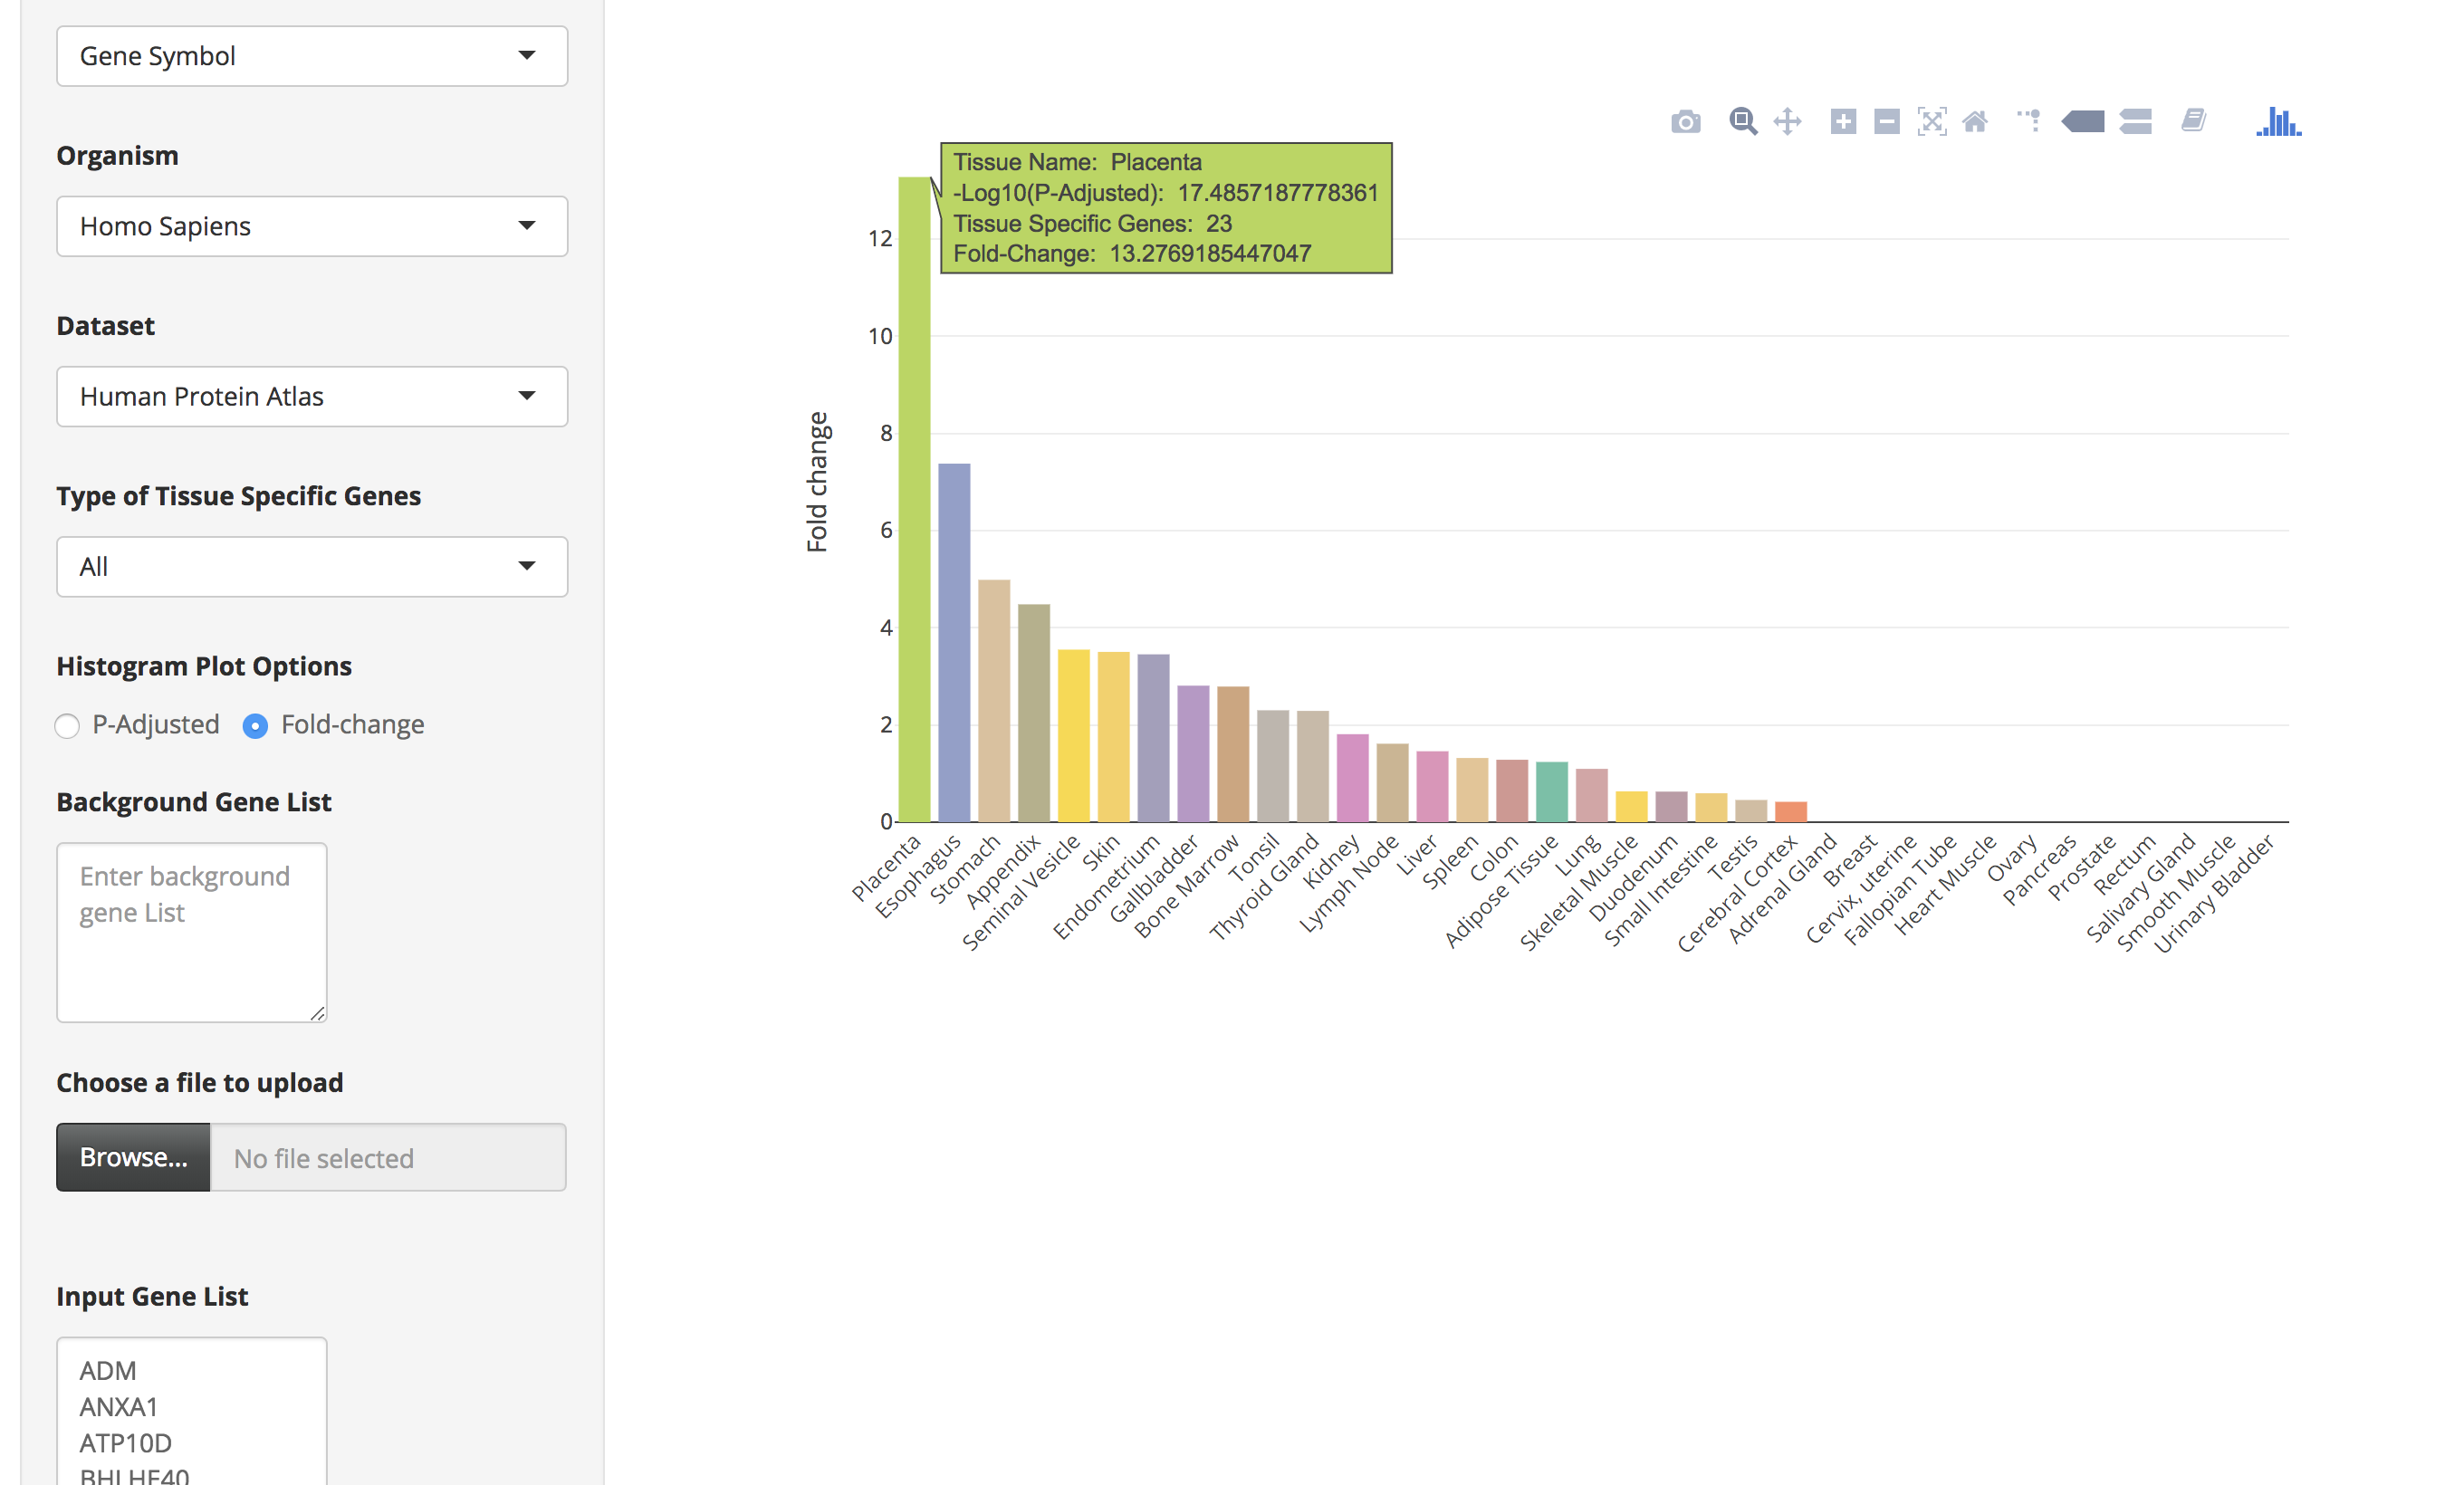
There is also an option ("Histogram Plot Options") to plot the bar charts using fold-change values. For that the user has to select the fold-change option and then click on the submit button.
Steps to calculate tissue-specific enrichment using orthologs in human and mouse
-
Click on the "Tissue Enrichment" tab to go to the tissue enrichment page.
-
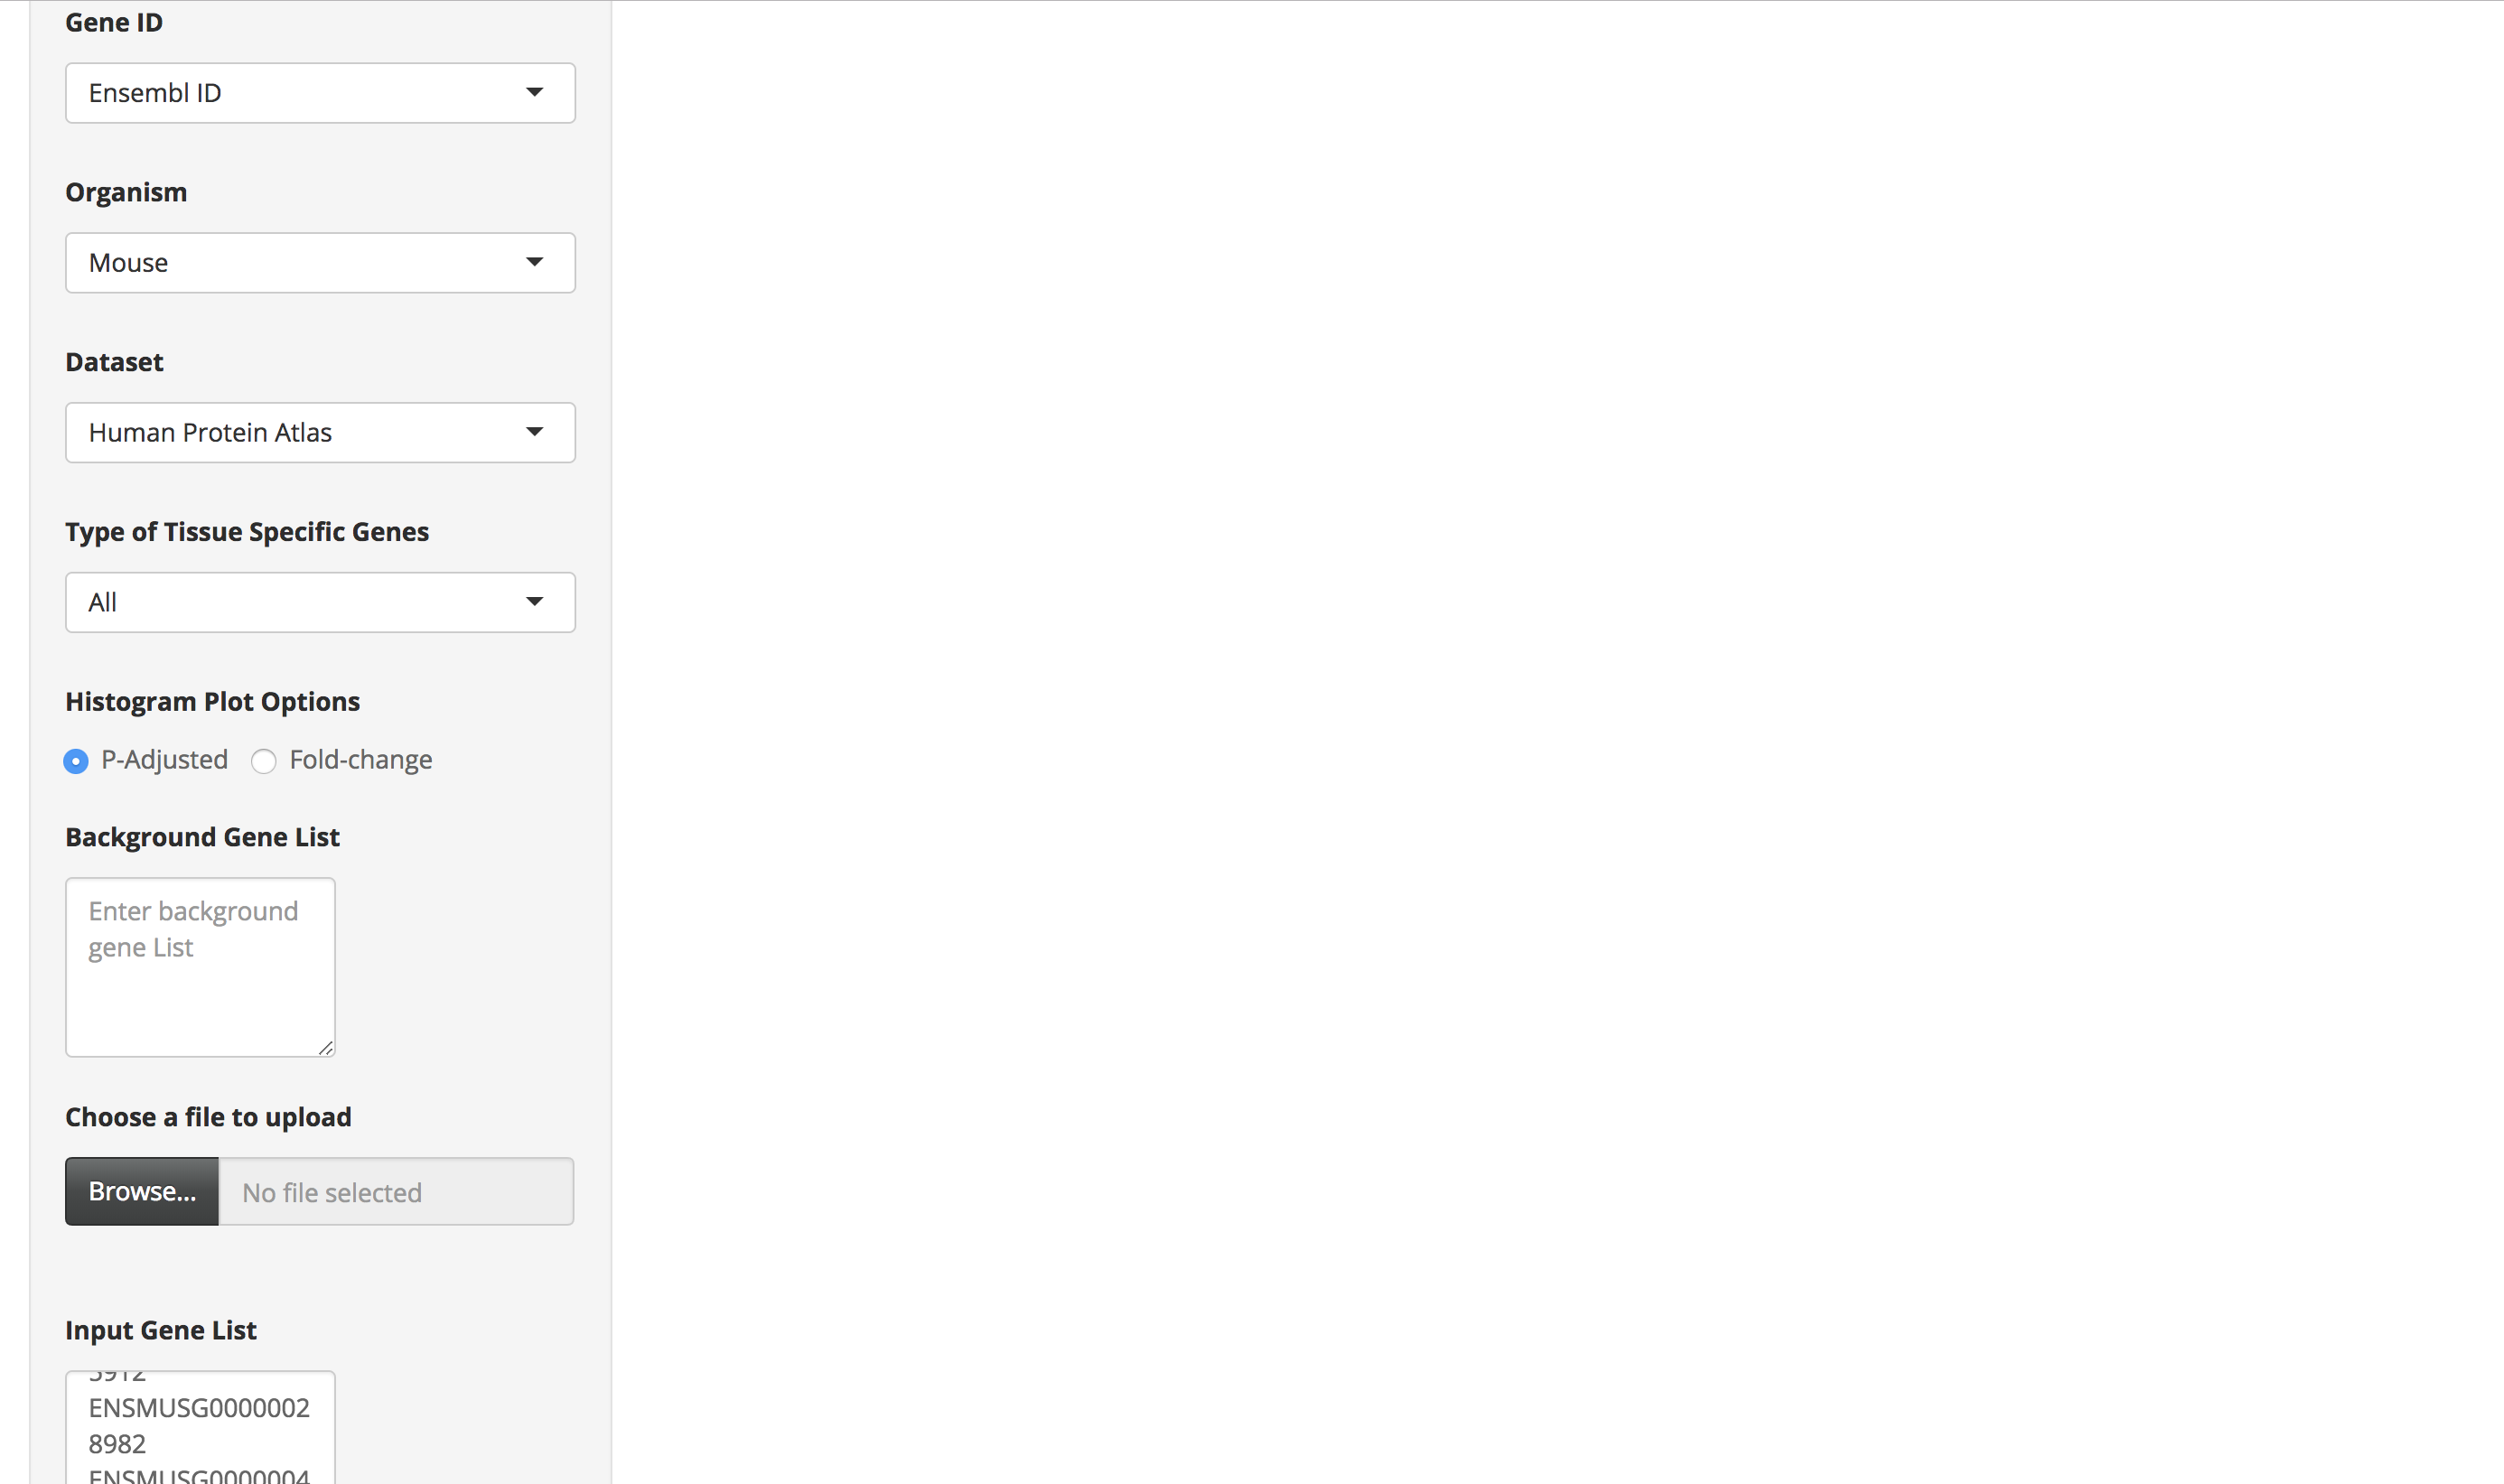
Enter a mouse gene list by either pasting it in the "Gene List" text area or by uploading the file. Each gene ID in the gene list should be in a new line.
-
Choose the "Mus Musculus" option as the organism and select either of the Human datasets (Human protein atlas or GTEx) as the dataset. Also, appropriately select the other options provided on the page.
-
Click on the submit button. A bar chart will be generated, showing the enrichment of tissue-specific genes in your list. Above the bar chart, you will also find the genes that could not mapped to the tissue-specific genes.
Note:
The tissue-specific gene enrichment uses 1 to 1 orthologs between human and mouse downloaded from the Ensembl Version 91 database.
Steps to obtain gene expression details for tissue-specific genes
-
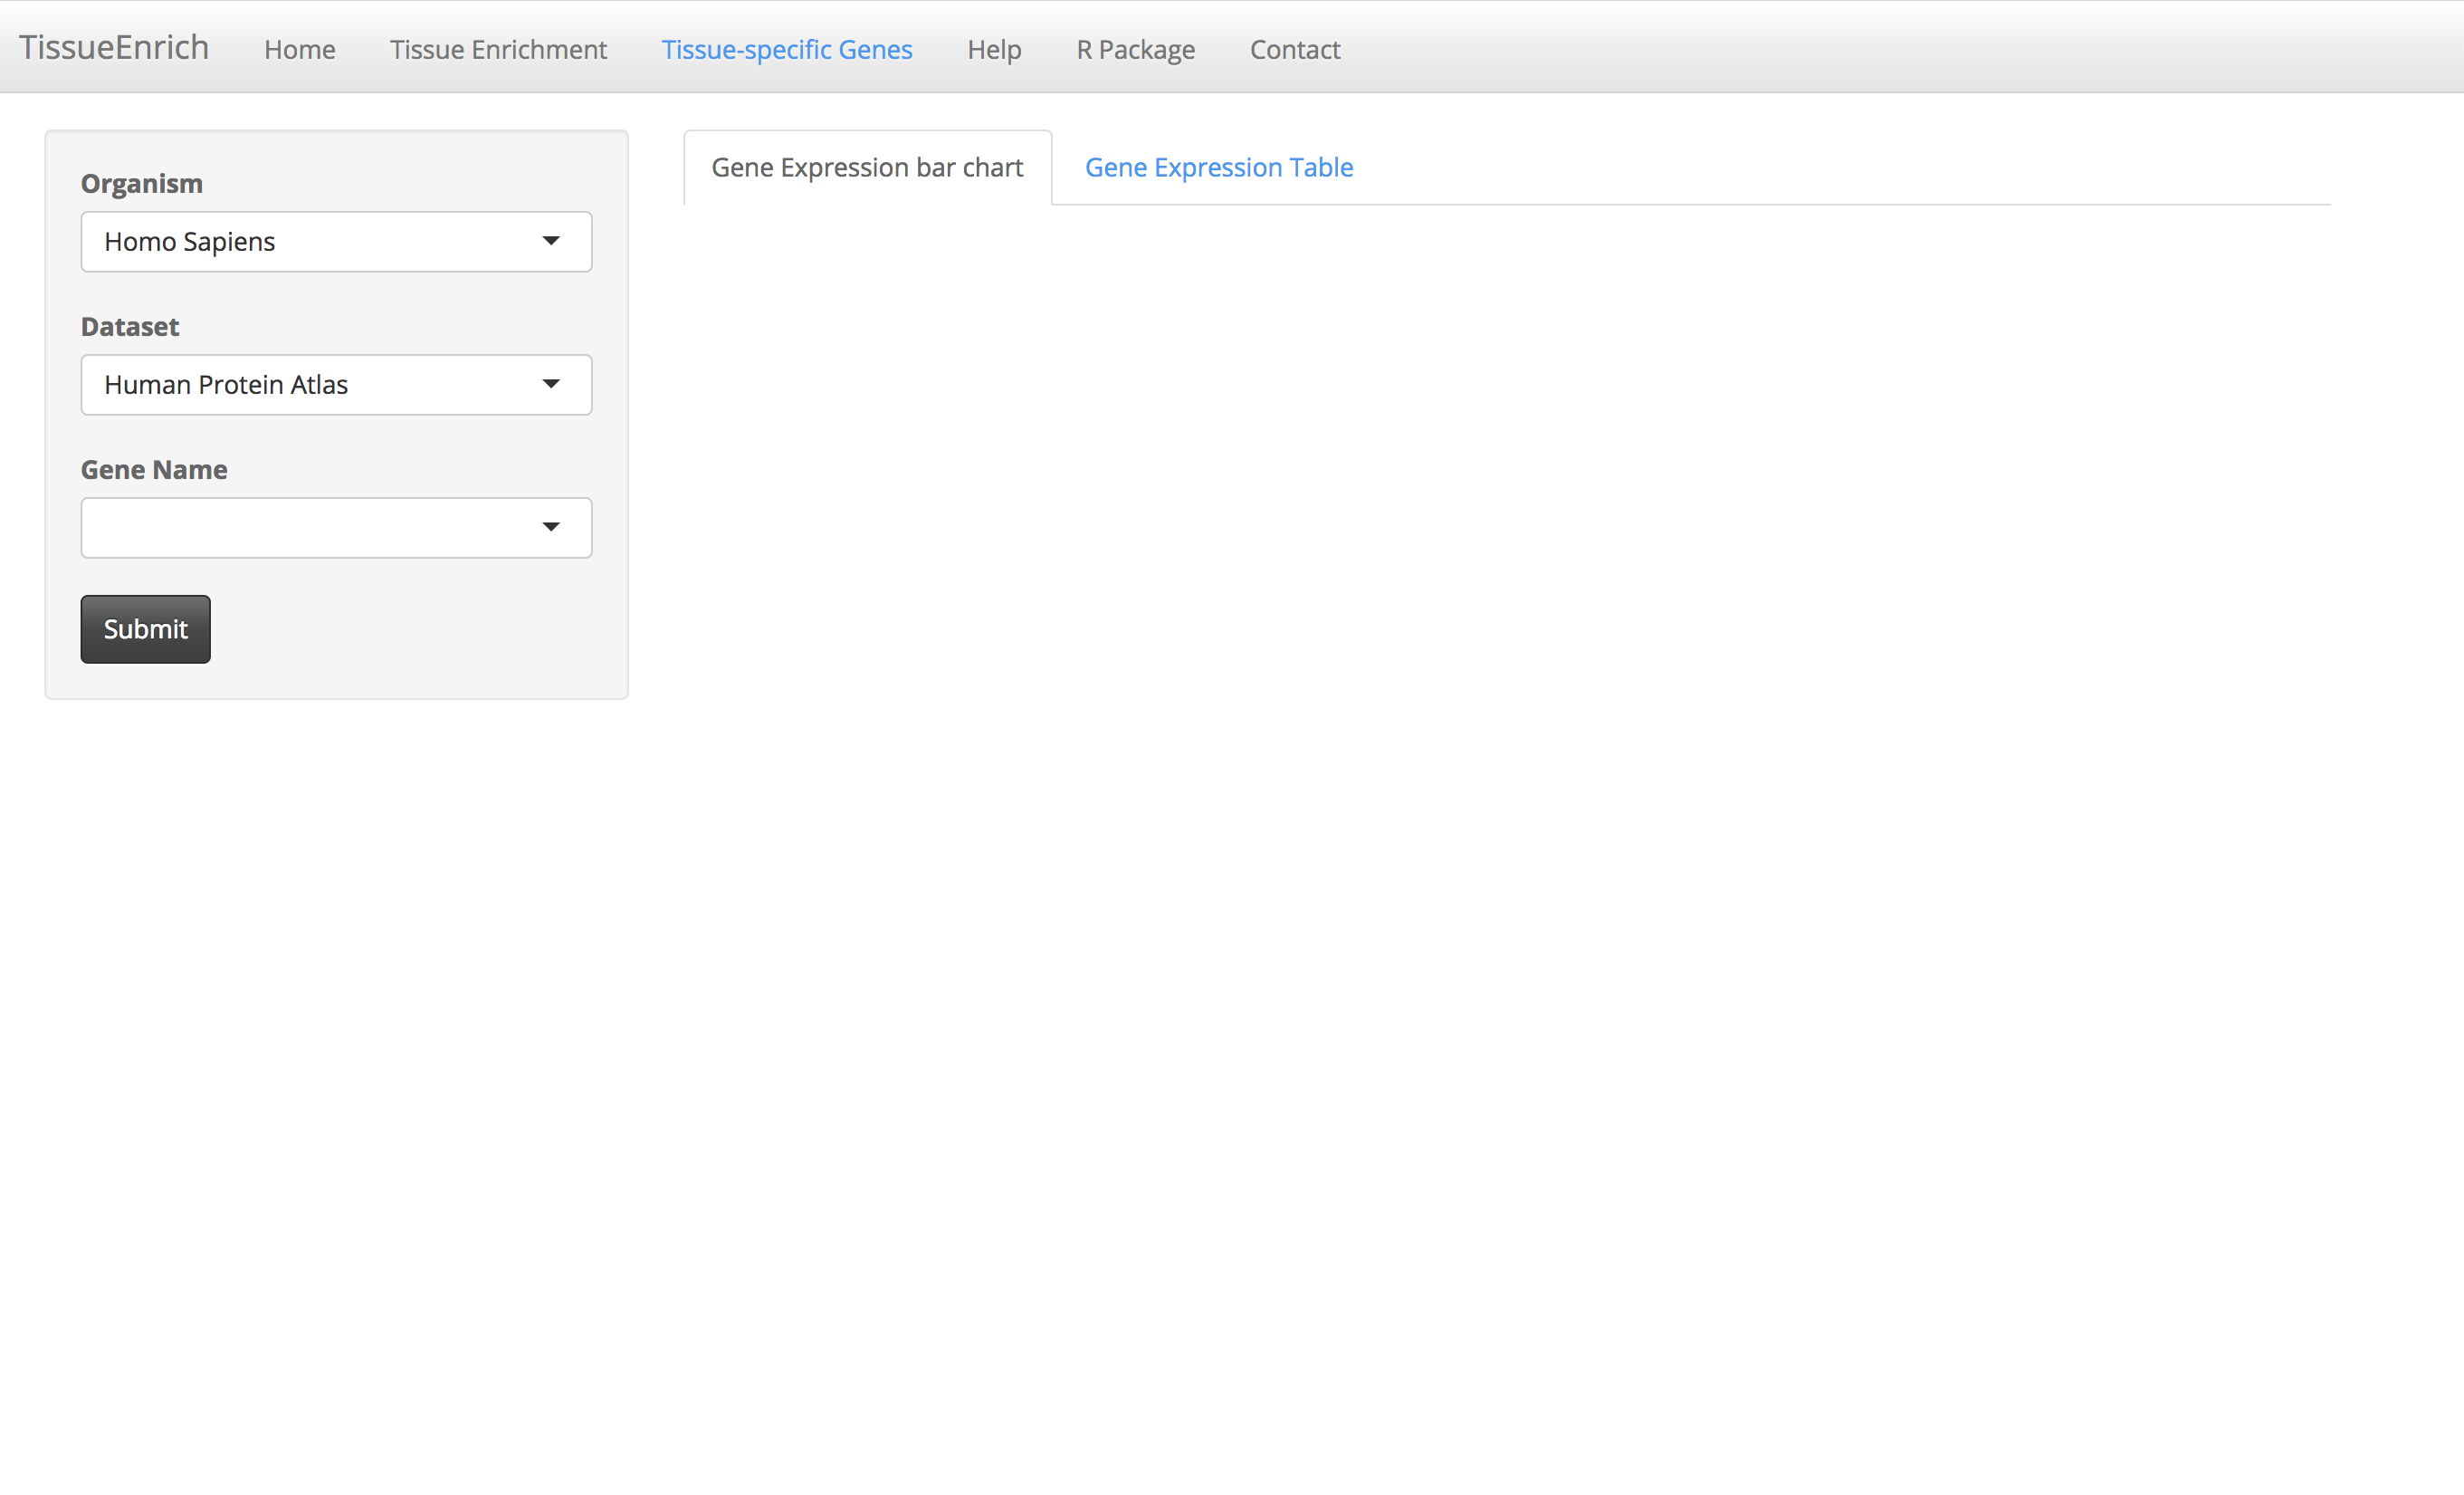
Click on the "Tissue-specific Genes" tab.
-
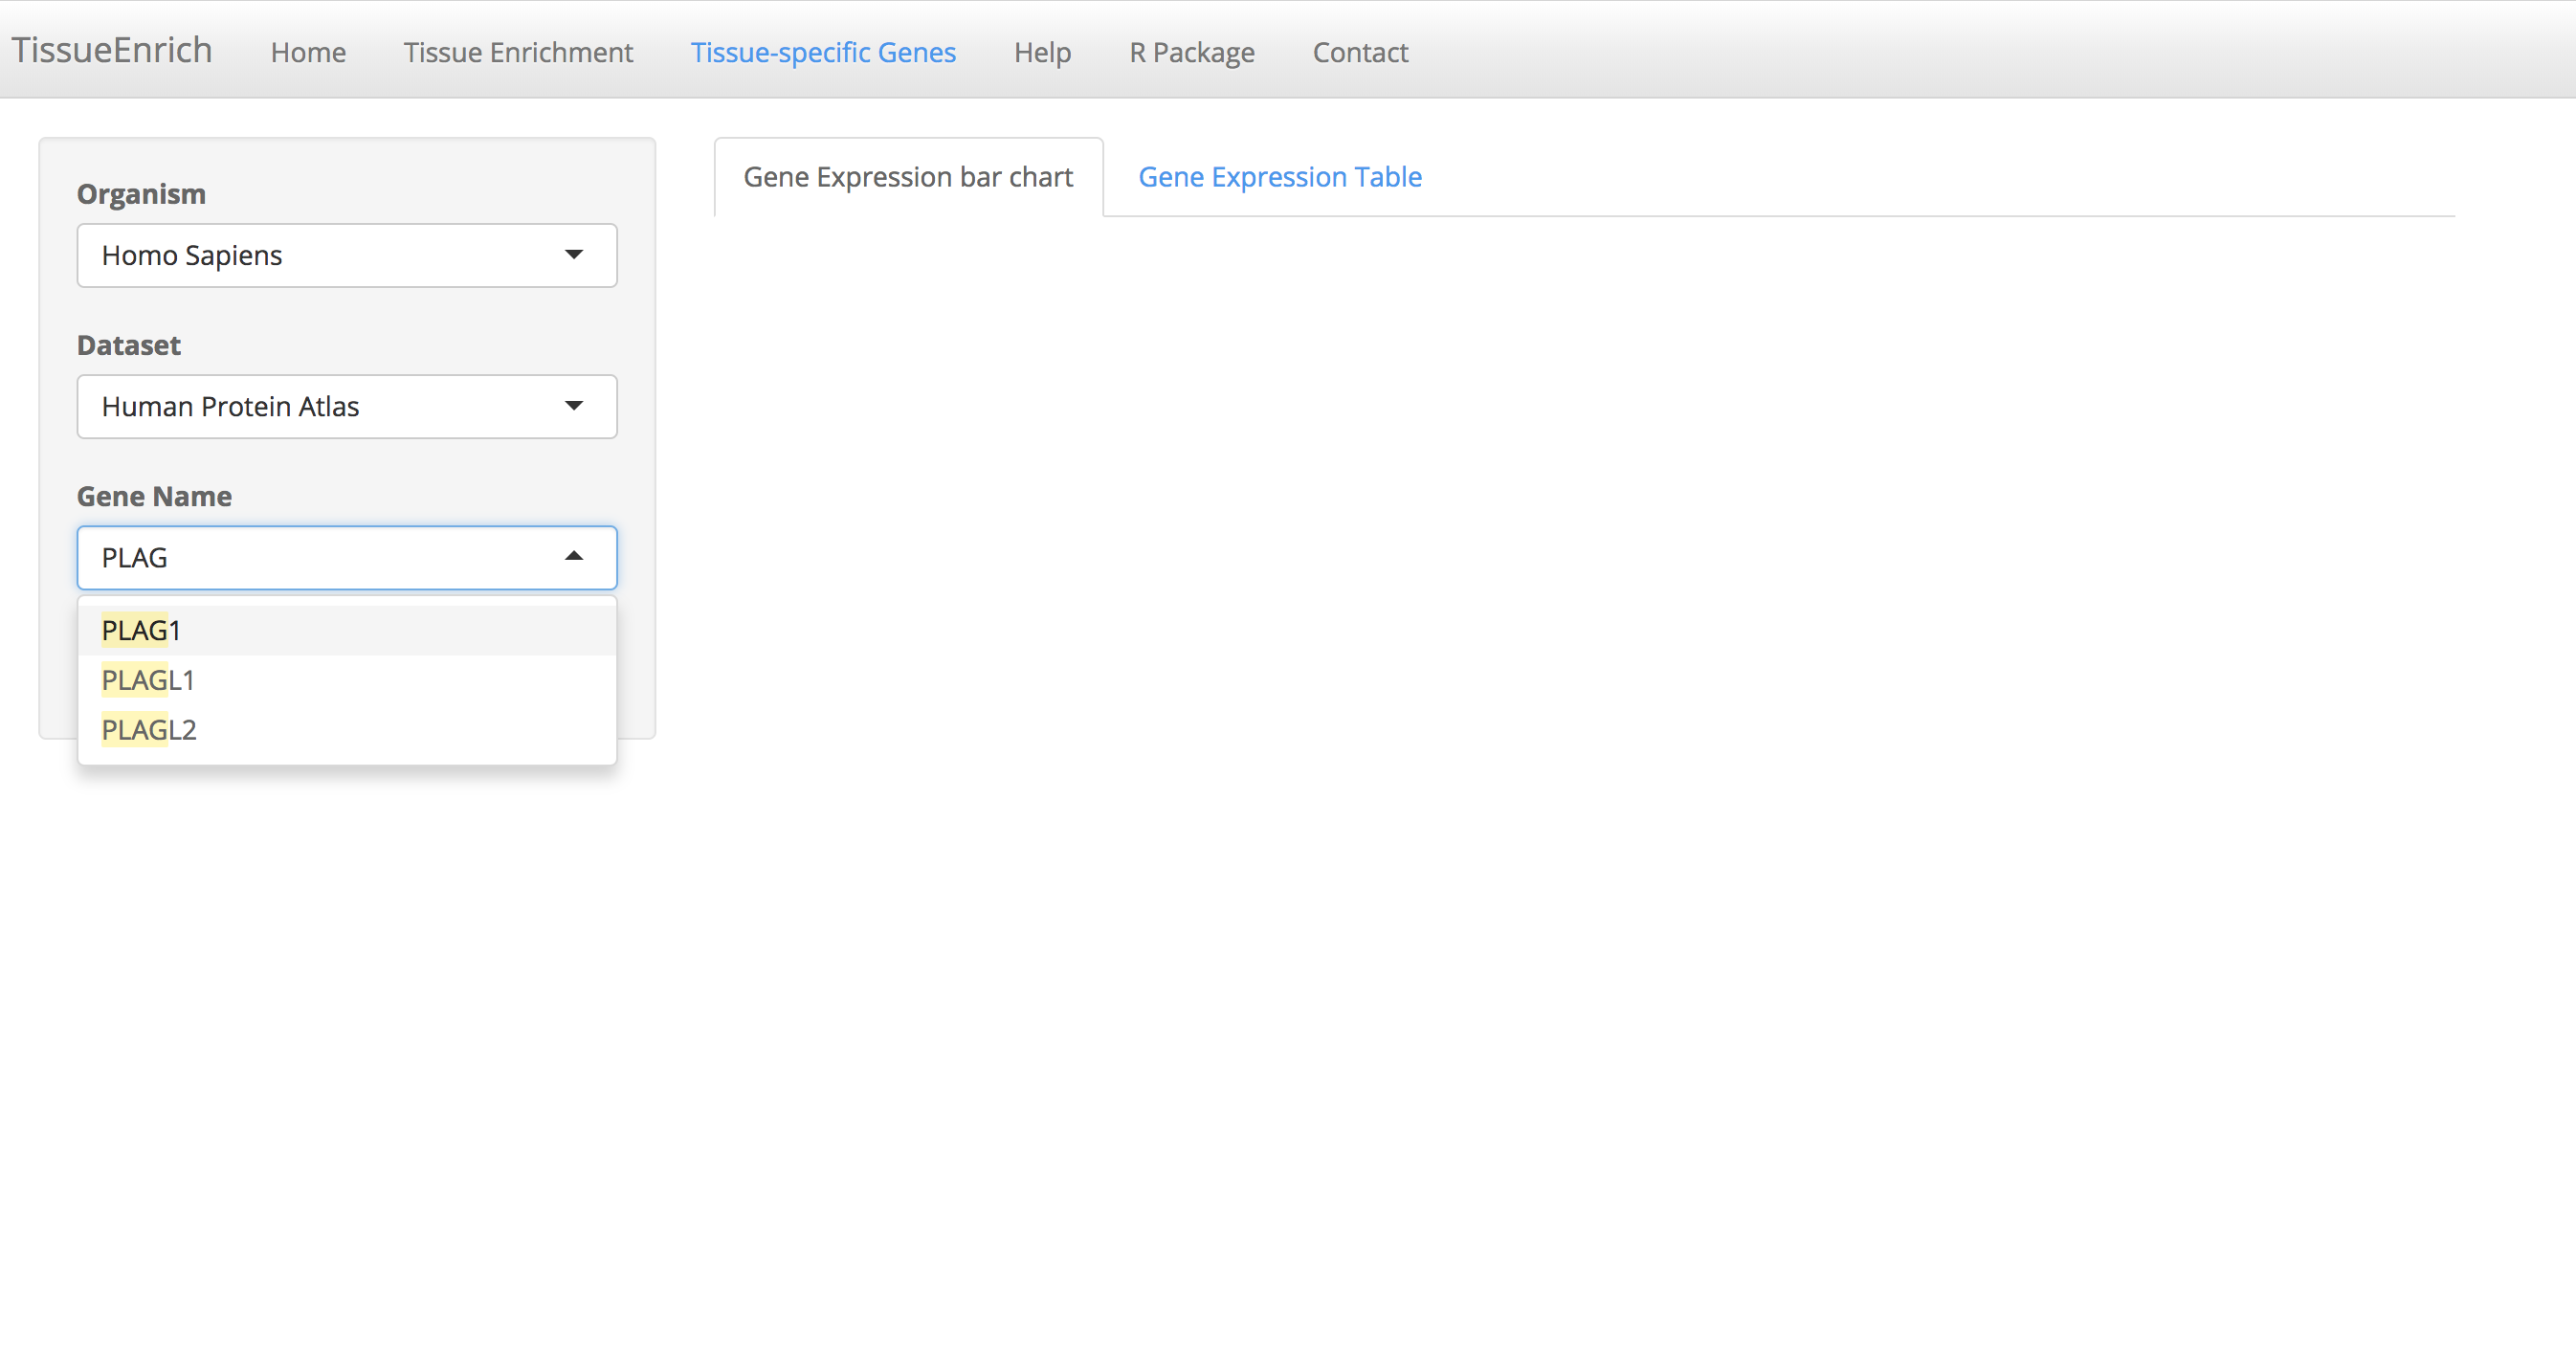
Choose the organism, and dataset. The user can enter and search the gene name in the "Gene Name" text box (Auto-fill feature).
-
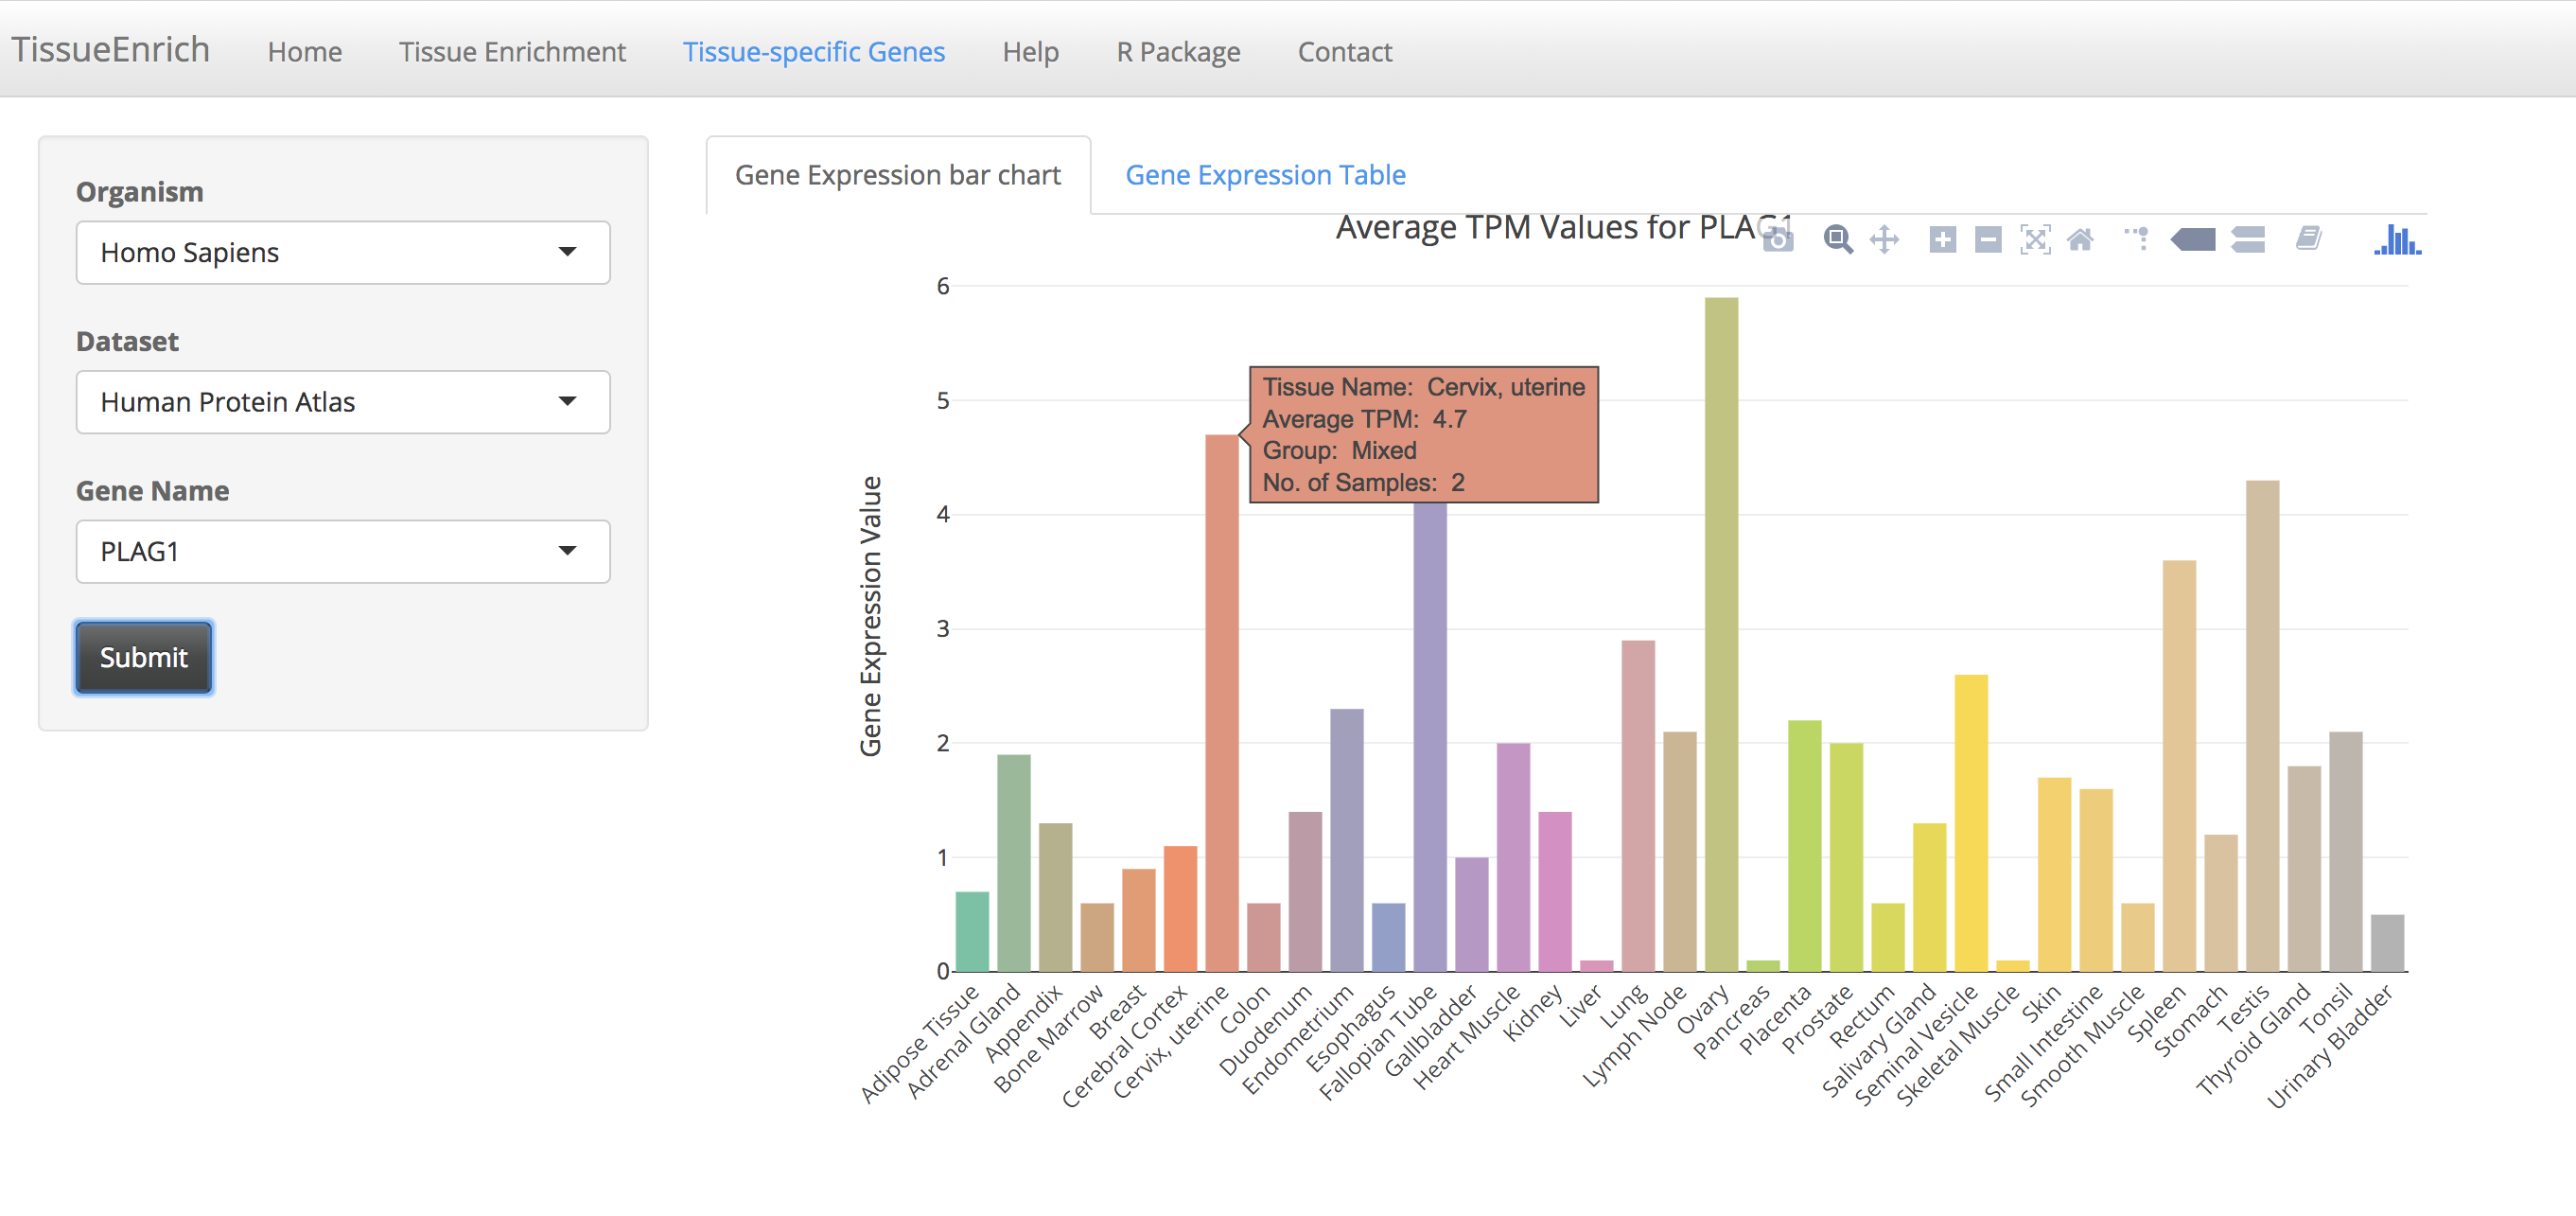
Click on the submit button. A bar chart will be generated, showing the expression values of the gene across the tissues along with its tissue specificity information.
-
The bar chart is interactive and the user can hover over the bar chart to see the details including tissue name, expression values, and tissue specificity.
-
Users can also view the details in a table by clicking the "Gene Expression Table" tab.

How should I interpret my results?
-
The recommended threshold value of the adjusted p-values for selecting the enriched tissues is 0.01.
-
Before, carrying out the tissue-specific gene enrichment check whether the expected tissue is present in the dataset or not. For example, we used the HPA data for the analysis of "Sample List 1", since GTEx does not include data from the placenta.
-
It is also recommended that the users should look at tissue-specific gene enrichment from all the three sources and have the highest confidence in results that are consistent across datasets (Given that the expected tissue is present in all the datasets).
-
The R package has more flexible settings for advanced users. For example, calculating tissue-specific gene enrichment from input gene expression data.
TissueEnrich R package
Requirements
-
R Version 3.5 or above
-
dplyr (>= 0.7.3)
-
ensurer (>= 1.1)
-
ggplot2 (>= 2.2.1)
-
tidyr (>= 0.8.0)
-
SummarizedExperiment (>= 1.6.5)
-
GSEABase (>= 1.38.2)
How to install the R package from
Bioconductor
-
source("https://bioconductor.org/biocLite.R")
-
biocLite("TissueEnrich")
How to install the R package from
GitHub
-
Download or fork the bitbucket repository
-
Open R terminal or RStudio terminal
-
Install Dependencies
install.packages(c("dplyr","ensurer","ggplot2","tidyr","devtools"))
-
source("https://bioconductor.org/biocLite.R");biocLite(c("SummarizedExperiment","GSEABase"))
-
Run command
devtools::install_github("Tuteja-Lab/TissueEnrich")
)
Contact Details
Tuteja Lab (
geetu@iastate.edu
)
2106 Molecular Biology Building
2437 Pammel Drive
Department of Genetics, Development and Cell Biology
Iowa State University
Ames, IA 50011